


Small sample hyperspectral image classification method based on memory association learning
-
摘要:
高光谱图像(HSI)分类是遥感领域的基础应用之一。该任务旨在根据部分带类别标签的像素样本训练分类器,预测图像中剩余像素对应的类别标签。在实际应用中,由于人工标记样本成本过高,只能获得少量带标签的样本。针对少量样本无法准确描述数据分布从而导致训练过程过拟合的问题,提出一种基于记忆关联学习的小样本高光谱图像分类方法。考虑到无标签样本中包含大量与数据分布相关的信息,构建基于有标签样本记忆模块,并根据样本间的特征关联,利用不断更新的记忆模块学习无标签样本的潜在类别分布,构建无监督分类模型,并与传统的有监督分类模型进行联合学习。在多个高光谱图像分类数据集上的实验结果表明,所提方法能有效提升小样本高光谱图像分类的准确性。
-
关键词:
- 记忆关联学习 /
- 半监督 /
- 小样本 /
- 高光谱图像(HSI) /
- 分类
Abstract:Hyperspectral Image (HSI) classification is one of the fundamental applications in remote sensing domain. Due to the expensive cost of manual labeling in HSIs, in real applications, only small labeled samples can be obtained. However, limited samples cannot accurately describe the data distribution and often cause the training of classifiers to be overfitting. To address this problem, we present a small sample hyperspectral image classification method based on memory association learning. First, considering that the unlabeled samples also contain a lot of information related to the data distribution, we construct a memory module based on the labeled samples. Then, according to the feature association among labeled and unlabeled samples, we learn the label distribution of the unlabeled sample with the continuously updated memory module. Finally, we build an unsupervised classifier model and a supervised classifier model, and jointly learn these two models. Extensive experimental results on multiple hyperspectral image classification datasets demonstrate that the proposed method can effectively improve the accuracy of small sample HSI classification.
-

图 1 基于记忆关联学习的小样本高光谱图像分类方法流程
Figure 1. Flowchart of small sample hyperspectral image classification method based on memory association learning

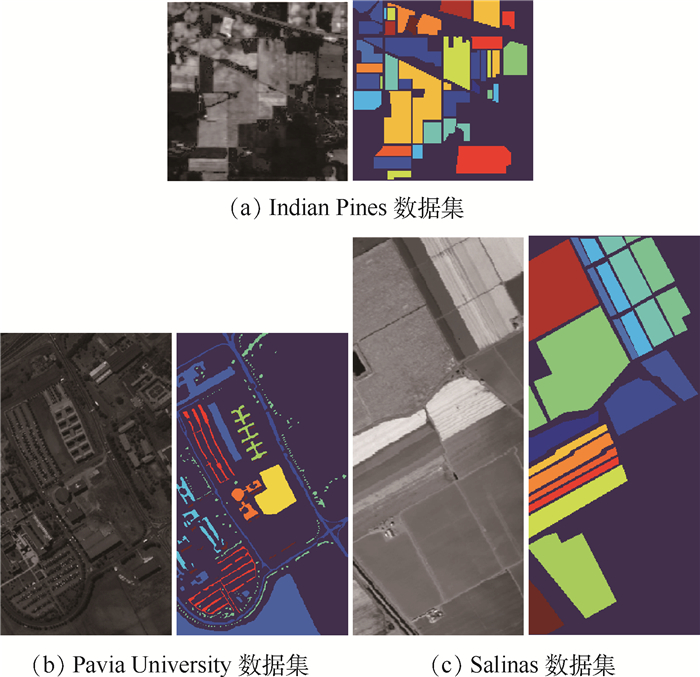
图 2 三个高光谱图像分类数据集的代表性波段图像和真实分类结果
Figure 2. Representative band image and ground truth classification map of three HSI classification datasets

图 3 Indian Pines数据集上的分类结果
Figure 3. Classification results of different methods on Indian Pines datasets

图 4 Pavia University数据集上的分类结果
Figure 4. Classification results of different methods on Pavia University datasets

图 5 Salinas数据集上的分类结果
Figure 5. Classification results of different methods on Salinas datasets
表 1 Indian Pines数据集中样本类别和样本数
Table 1. Name and pixel numbers of per adopted class on Indian Pines datasets
序号 样本类别名称 样本数 1 Alfalfa 46 2 Corn-notill 1 428 3 Corn-mintill 830 4 Corn 237 5 Grass-pasture 483 6 Grass-trees 730 7 Grass-pasture-mowed 28 8 Hay-windrowed 478 9 Oats 20 10 Soybean-notill 972 11 Soybean-mintill 2 455 12 Soybean-clean 593 13 Wheat 205 14 Woods 1 265 15 Buildings-Grass-Trees-Drives 386 16 Stone-Steel-Towers 93 总计 10 249  下载: 导出CSV
表 2 Pavia University数据集中样本类别和样本数
Table 2. Name and pixel numbers of per adopted class on Pavia University datasets
序号 样本类别名称 样本数 1 Asphalt 6 631 2 Meadows 18 649 3 Gravel 2 099 4 Trees 3 064 5 Painted metal sheets 1 345 6 Bare Soil 5 029 7 Bitumen 1 330 8 Self-Blocking Bricks 3 682 9 Shadows 947 总计 42 776
下载: 导出CSV
表 3 Salinas数据集中样本类别和样本数
Table 3. Name and pixel numbers of per adopted class on Salinas datasets
序号 样本类别名称 样本数 1 Brocoli_green_weeds_1 2 009 2 Brocoli_green_weeds_2 3 726 3 Fallow 1 976 4 Fallow_rough_plow 1 394 5 Fallow_smooth 2 678 6 Stubble 3 959 7 Celery 3 579 8 Grapes_untrained 11 271 9 Soil_vinyard_develop 6 203 10 Corn_senesced_green_weeds 3 278 11 Lettuce_romaine_4wk 1 068 12 Lettuce_romaine_5wk 1 927 13 Lettuce_romaine_6wk 916 14 Lettuce_romaine_7wk 1 070 15 Vinyard_untrained 7 268 16 Vinyard_vertical_trellis 1 807 总计 54 129
下载: 导出CSV
表 4 卷积网络
Table 4. Convolution network
卷积层 卷积核 卷积步长 特征数 补齐 conv1 (3, 1, 8) (1, 1, 3) 64 valid conv2 (1, 1, 3) (1, 1, 2) 64 valid conv3 (1, 3, 3) (1, 1, 2) 128 valid conv4 (1, 1, 3) (1, 1, 2) 128 valid conv5 (1, 1, 3) (1, 1, 2) 256 valid conv6 (1, 1, s) (1, 1, 1) 128 valid
下载: 导出CSV
表 6 不同方法在Indian Pines数据集上的分类结果
Table 6. Classification results of different methods on Indian Pines datasets
% 序号 KNN SVM 1D-CNN 3D-CNN SS-CNN ISSR-HIC 本文方法 1 86.11 82.50 79.44 79.44 76.09 90.76 63.89 2 44.63 41.70 31.71 29.28 18.00 55.25 10.65 3 36.05 47.74 47.63 44.15 6.86 52.56 11.59 4 48.02 57.31 49.16 42.29 70.04 64.98 46.26 5 69.98 76.77 74.97 77.59 17.18 76.09 64.38 6 64.39 81.19 89.44 87.72 80.41 85.82 92.36 7 92.22 92.22 83.33 98.89 92.86 92.86 91.67 8 66.03 82.46 76.03 77.82 78.87 78.09 97.44 9 68.00 98.00 94.00 100 100 95.00 90.00 10 39.33 49.95 49.29 54.51 55.33 55.14 17.05 11 29.87 39.75 38.45 46.74 68.73 47.82 89.65 12 26.83 42.04 38.46 36.50 31.20 48.06 23.50 13 90.15 93.23 92.00 96.62 93.17 95.61 92.56 14 61.96 66.22 70.17 70.80 96.05 74.35 84.22 15 14.31 36.91 46.65 38.24 38.95 41.97 28.99 16 86.02 91.57 88.43 98.07 100 93.55 96.99 AA 57.74 67.47 65.57 67.42 63.98 71.74 62.57 OA 44.99 53.80 52.60 54.26 55.44 60.63 56.94 Kappa 38.69 48.46 47.16 48.71 48.96 55.87 49.28
下载: 导出CSV
表 7 不同方法在Pavia University数据集上的分类结果
Table 7. Classification results of different methods on Pavia University datasets
% 序号 KNN SVM 1D-CNN 3D-CNN SS-CNN ISSR-HIC 本文方法 1 58.07 68.75 68.15 68.84 75.19 69.44 96.55 2 66.60 68.17 62.95 74.63 86.05 65.22 91.94 3 48.22 66.40 66.18 68.43 61.99 66.33 62.83 4 85.38 82.27 86.64 90.22 93.81 85.13 83.72 5 92.27 99.28 99.43 98.97 99.18 99.57 99.91 6 29.25 67.02 71.30 50.37 32.85 67.21 39.74 7 89.97 87.83 86.50 87.88 74.06 91.24 90.71 8 56.00 81.55 71.14 73.40 72.41 80.75 92.46 9 99.89 99.91 99.96 99.59 97.99 98.76 100 AA 70.07 80.13 79.14 79.15 77.06 80.41 84.21 OA 62.83 72.47 69.98 73.30 76.47 71.56 84.94 Kappa 53.02 65.14 70.32 65.79 68.95 64.38 79.65
下载: 导出CSV
表 8 不同方法在Salinas数据集上的分类结果
Table 8. Classification results of different methods on Salinas datasets
% 序号 KNN SVM 1D-CNN 3D-CNN SS-CNN ISSR-HIC 本文方法 1 98.27 94.92 95.55 91.23 99.29 97.55 99.28 2 81.15 97.47 99.77 97.34 98.09 97.82 99.60 3 74.38 87.60 92.33 89.70 69.38 86.29 98.19 4 94.45 99.29 98.71 95.55 97.99 98.05 99.47 5 88.54 92.83 90.41 93.64 99.18 95.44 94.61 6 96.58 98.34 99.21 96.28 99.09 99.25 99.26 7 98.55 98.83 99.00 96.02 99.80 99.46 99.46 8 62.39 53.00 68.02 58.28 25.30 58.08 79.12 9 91.36 96.03 95.60 92.80 99.00 96.02 99.03 10 58.92 83.71 83.48 76.08 81.96 82.82 74.96 11 78.11 86.60 93.72 87.75 86.48 95.13 96.96 12 91.46 99.74 99.45 99.46 99.90 98.62 99.96 13 98.72 98.10 95.74 95.81 99.56 96.97 99.58 14 88.17 90.91 94.11 92.87 94.53 95.35 94.83 15 52.84 70.70 54.26 69.76 93.09 67.23 56.91 16 43.17 90.04 79.67 90.16 77.30 92.17 98.25 AA 81.32 89.88 89.94 88.92 88.75 91.02 92.74 OA 76.20 82.61 83.57 82.31 79.73 83.72 87.31 Kappa 73.56 80.76 81.74 80.41 77.69 81.97 85.84
下载: 导出CSV
表 9 Indian Pines数据集上不同数量训练样本下的分类结果
Table 9. Classification results of different methods with changed numbers of training samples on Indian Pines datasets
% 方法 评价指标 训练样本数 1 5 10 50 100 200 3D-CNN AA 32.96 54.23 67.42 87.42 91.09 92.64 OA 22.70 43.42 54.26 77.01 85.54 87.71 Kappa 15.33 36.90 48.71 72.32 83.47 85.68 ISSR-HIC AA 40.93 66.35 71.74 84.31 88.73 91.01 OA 30.55 55.05 60.63 79.09 81.14 84.22 Kappa 23.31 49.64 55.87 75.79 78.80 82.22 本文方法 AA 33.77 48.18 62.57 89.45 92.49 95.80 OA 39.60 49.94 56.94 83.92 86.27 92.46 Kappa 29.67 41.64 49.28 81.54 84.16 91.14
下载: 导出CSV
表 10 Pavia University数据集上不同数量训练样本下的分类结果
Table 10. Classification results of different methods with changed numbers of training samples on Pavia University datasets
% 方法 评价指标 样本数 1 5 10 50 100 200 3D-CNN AA 55.03 68.27 79.15 92.70 95.74 96.04 OA 49.97 63.81 73.30 92.15 94.84 96.43 Kappa 37.48 53.36 65.79 89.65 93.18 95.22 ISSR-HIC AA 65.94 76.94 80.41 86.10 89.89 92.51 OA 53.46 62.72 71.56 81.55 86.84 90.52 Kappa 43.11 54.70 64.38 76.26 82.93 87.63 本文方法 AA 55.80 72.21 84.21 95.83 97.87 98.80 OA 55.81 73.89 84.94 97.32 98.42 99.31 Kappa 41.88 65.14 79.65 96.41 97.89 99.07
下载: 导出CSV
表 11 Salinas数据集上不同数量训练样本下的分类效果
Table 11. Classification results of different methods with changed numbers of training samples on Salinas datasets
% 方法 评价指标 样本数 1 5 10 50 100 200 3D-CNN AA 62.02 85.24 88.92 94.08 94.76 95.82 OA 57.24 76.97 82.31 87.25 88.13 89.86 Kappa 53.04 74.61 80.41 85.83 86.79 88.68 ISSR-HIC AA 77.67 87.39 91.02 94.47 96.01 96.63 OA 70.65 79.93 83.72 90.21 91.52 91.97 Kappa 67.44 77.67 81.97 89.13 90.56 91.08 本文方法 AA 78.30 90.99 92.74 94.56 96.76 97.27 OA 78.30 85.49 87.31 89.01 92.78 93.65 Kappa 74.39 83.83 85.84 87.73 91.94 92.89
下载: 导出CSV
表 12 不同损失函数在不同数据集上的分类结果
Table 12. Classification results of the proposed methods with different loss function on three datasets
% 数据集 评价指标 损失函数 


Indian Pines AA 62.57 55.58 61.20 OA 56.94 52.26 48.33 Kappa 49.28 45.28 42.28 Pavia University AA 84.21 83.08 77.42 OA 84.94 81.64 68.68 Kappa 79.65 75.38 60.88 Salinas AA 92.74 90.78 90.08 OA 87.31 85.49 83.29 Kappa 85.84 83.78 81.46
下载: 导出CSV
-
[1] LANDGREBE D. Hyperspectral image data analysis[J]. IEEE Signal Processing Magazine, 2002, 19(1): 17-28. doi: 10.1109/79.974718 [2] BISHOP C A, LIU J G, MASON P J. Hyperspectral remote sensing for mineral exploration in Pulang, Yunnan Province, China[J]. International Journal of Remote Sensing, 2011, 32(9): 2409-2426. doi: 10.1080/01431161003698336 [3] ZHANG B, WU D, ZHANG L, et al. Application of hyperspectral remote sensing for environment monitoring in mining areas[J]. Environmental Earth Sciences, 2012, 65(3): 649-658. doi: 10.1007/s12665-011-1112-y [4] ZHANG Y X, DU B, ZHAGN L P, et al. Joint sparse representation and multitask learning for hyperspectral target detection[J]. IEEE Transactions on Geoscience and Remote Sensing, 2017, 55(2): 894-906. doi: 10.1109/TGRS.2016.2616649 [5] WANG C, ZHANG L, WEI W, et al. When low rank representation based hyperspectral imagery classification meets segmented stacked denoising auto-encoder based spatial-spectral feature[J]. Remote Sensing, 2018, 10(2): 284. doi: 10.3390/rs10020284 [6] PAN E T, MEI X G, WANG Q D, et al. Spectral-spatial classification for hyperspectral image based on a single GRU[J]. Neurocomputing, 2020, 387: 150-160. doi: 10.1016/j.neucom.2020.01.029 [7] GUO G D, WANG H, BELL D A, et al. KNN model-based approach in classification[C]//OTM Confederated International Conferences "On the Move to Meaningful Internet Systems". Berlin: Springer, 2003: 986-996. [8] MELGANI F, BRUZZONE L. Classification of hyperspectral remote sensing images with support vector machines[J]. IEEE Transactions on Geoscience and Remote Sensing, 2004, 42(8): 1778-1790. doi: 10.1109/TGRS.2004.831865 [9] LI W, DU Q. Joint within-class collaborative representation for hyperspectral image classification[J]. IEEE Journal of Selected Topics in Applied Earth Observations and Remote Sensing, 2014, 7(6): 2200-2208. doi: 10.1109/JSTARS.2014.2306956 [10] HU W, HUANG Y Y, LI W, et al. Deep convolutional neural networks for hyperspectral image classification[J]. Journal of Sensors, 2015, 2015: 258619. [11] LIU X F, SUN Q Q, LIU B, et al. Hyperspectral image classification based on convolutional neural network and dimension reduction[C]//2017 Chinese Automation Congress. Piscataway: IEEE Press, 2017: 1686-1690. [12] LEE H, KWON H. Going deeper with contextual CNN for hyperspectral image classification[J]. IEEE Transactions on Image Processing, 2017, 26(10): 4843-4855. doi: 10.1109/TIP.2017.2725580 [13] ZHONG Z L, LI J, LUO Z M, et al. Chapman: Spectral-spatial residual network for hyperspectral image classification: A 3-D deep learning framework[J]. IEEE Transactions on Geoscience and Remote Sensing, 2018, 56(2): 847-858. doi: 10.1109/TGRS.2017.2755542 [14] FANG B, LI Y, ZHAGN H K, et al. Hyperspectral images classification based on dense convolutional networks with spectral-wise attention mechanism[J]. Remote Sensing, 2019, 11(2): 159. doi: 10.3390/rs11020159 [15] PAOLETTI M E, HAUT J M, BELTRAN R F, et al. Capsule networks for hyperspectral image classification[J]. IEEE Transactions on Geoscience and Remote Sensing, 2019, 57(4): 2145-2160. doi: 10.1109/TGRS.2018.2871782 [16] SAMIAPPAN S, MOORHEAD R J. Semi-supervised co-training and active learning framework for hyperspectral image classification[C]//IEEE International Geoscience and Remote Sensing Symposium (IGARSS). Piscataway: IEEE Press, 2015: 401-404. [17] RASMUS A, VALPOLA H, HONKALA M, et al. Semi-supervised learning with ladder networks[EB/OL]. (2015-07-09)[2020-08-01]. https://arxiv.org/abs/1507.02672. [18] WEI W, ZHAGN L, LI Y, et al. Intraclass similarity structure representation-based hyperspectral imagery classification with few samples[J]. IEEE Journal of Selected Topics in Applied Earth Observations and Remote Sensing, 2020, 13: 1045-1054. doi: 10.1109/JSTARS.2020.2977655 [19] LI W, WU G D, ZHANG F, et al. Hyperspectral image classification using deep pixel-pair features[J]. IEEE Transactions on Geoscience and Remote Sensing, 2017, 55(2): 844-853. doi: 10.1109/TGRS.2016.2616355 [20] LIU B, YU X C, ZHAGN P Q, et al. A semi-supervised convolutional neural network for hyperspectral image classification[J]. Remote Sensing Letters, 2017, 8(9): 839-848. doi: 10.1080/2150704X.2017.1331053 [21] PONTIUS R G, MILLONES M. Death to Kappa: Birth of quantity disagreement and allocation disagreement for accuracy assessment[J]. International Journal of Remote Sensing, 2011, 32(15): 4407-4429. doi: 10.1080/01431161.2011.552923 -

 下载:
下载:


 点击查看大图

计量
- 文章访问数: 453
- HTML全文浏览量: 74
- PDF下载量: 129
- 被引次数: 0
