


-
摘要:
马氏距离判别法是一种基于马氏距离的多元统计分析方法,其引入了协方差矩阵的逆矩阵,以排除属性变量的量纲及变量之间的相关性对距离度量的干扰。然而,在属性变量存在严重的多重共线性时,样本协方差矩阵的奇异性会影响其逆矩阵估计的稳定性,从而降低马氏距离判别法的有效性。为此,提出了一种修正的马氏距离判别法,采用了一般交叉验证(GCV)方法,在属性变量间存在高度相关性的情况下,选择预测效果最好的变量维度,同时可以对协方差矩阵的逆矩阵进行稳定的估计。修正的马氏距离判别法可以得到可靠的协方差矩阵的估计,提高模型的判别准确率;也可以抵抗样本外的扰动,提高模型的泛化能力。仿真实验结果验证了在属性变量存在严重的多重共线性情形下,修正的马氏距离判别法的判别效果较经典的马氏距离判别法有明显的提升。
Abstract:Mahalanobis distance discriminant method is an effective multivariate statistical analysis method based on the Mahalanobis distance. An important feature of the Mahalanobis distance is its introduction of the inverse of covariance matrix, which avoids the disturbance to the distance measurement from the scales of the attribute variables and the correlations among these variables. However, when there is multicollinearity among the attribute variables, the singularity of the covariance matrix will affect the stability of the inverse matrix estimation, and will greatly damage the effect of the Mahalanobis distance discriminant method. We propose a modified Mahalanobis distance discriminant method, which adopts the general cross-validation (GCV) to choose the dimensions of these variables with the best prediction effect, so that the inverse of the covariance matrix can be well estimated when these attribute variables are highly correlated. The modified Mahalanobis distance discriminant method can provide a reliable estimation of the covariance matrix, resist the disturbances outside the sample set, improve the discriminant accuracy of the model, and enhance the generalization ability of the model. Simulations are conducted to verify the improvement of the discriminant performance of the modified Mahalanobis distance discriminant method compared with the classical one.
-

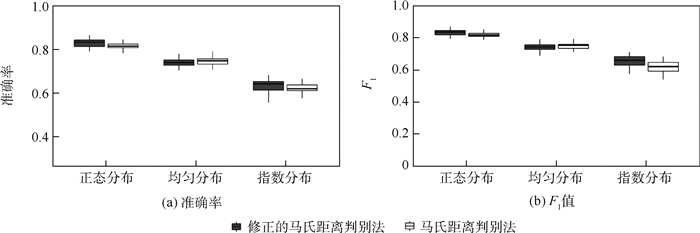
图 1 经典的马氏距离判别法与修正的马氏距离判别法的判别准确率和F1值的比较(δ=0)
Figure 1. Comparison of discriminant analysis accuracy and F1 value between typical Mahalanobis distance discriminant method and modified Mahalanobis distance discriminant method (δ=0)

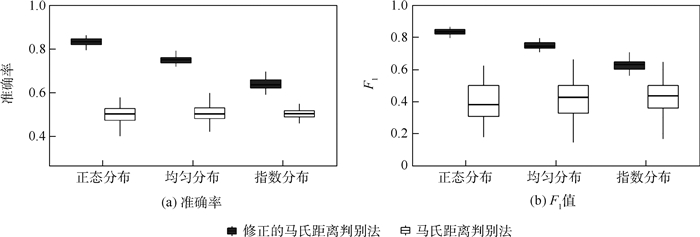
图 2 经典的马氏距离判别法与修正的马氏距离判别法的判别结果的比较(δ=0.3)
Figure 2. Comparison of discriminant results between classical Mahalanobis distance discriminant method and modified Mahalanobis distance discriminant method (δ=0.3)
表 1 三种分布下总体的参数设计
Table 1. Parameter design of populations following three types of distribution
分布类型 类别 x1 x2 正态分布 G1 
G2 
均匀分布 G1 U(0, 2) U(0, 1) G2 U(0, 1) U(0, 2) 指数分布 G1 E(2) E(1) G2 E(1) E(2)  下载: 导出CSV
表 2 两种方法的判别准确率和F1值比较(δ=0)
Table 2. Comparison of discriminant accuracy and F1 value between two methods (δ=0)
分布类型 修正的马氏距离判别法 马氏距离判别法 准确率均值(标准差) F1值均值(标准差) 准确率均值(标准差) F1值均值(标准差) 正态分布 0.84(0.02) 0.83(0.02) 0.50(0.04) 0.39(0.13) 均匀分布 0.75(0.02) 0.75(0.02) 0.51(0.04) 0.41(0.12) 指数分布 0.64(0.03) 0.63(0.03) 0.50(0.02) 0.42(0.12)
下载: 导出CSV
表 3 两种方法的判别准确率和F1值比较(δ=0.3)
Table 3. Comparison of discriminant accuracy and F1 value between two methods (δ=0.3)
分布类型 修正的马氏距离判别法 马氏距离判别法 准确率均值(标准差) F1值均值(标准差) 准确率均值(标准差) F1值均值(标准差) 正态分布 0.64(0.03) 0.65(0.04) 0.63(0.02) 0.62(0.04) 均匀分布 0.74(0.02) 0.74(0.02) 0.75(0.02) 0.75(0.02) 指数分布 0.64(0.03) 0.65(0.04) 0.63(0.02) 0.62(0.04)
下载: 导出CSV
-
[1] 上官丽英, 王惠文. 单形空间中多元成分数据的Fisher判别方法[J]. 北京航空航天大学学报, 2013, 39(10): 1376-1380. https://bhxb.buaa.edu.cn/CN/article/advancedSearchResult.doSHANGGUAN L Y, WANG H W. Fisher discriminant method for multiple compositional-data variables in simplex space[J]. Journal of Beijing University of Aeronautics and Astronautics, 2013, 39(10): 1376-1380(in Chinese). https://bhxb.buaa.edu.cn/CN/article/advancedSearchResult.do [2] CHI S P, MATTHEW Z H. A self-calibrated direct approach to precision matrix estimation and linear discriminant analysis in high dimensions[J]. Computational Statistics & Data Analysis, 2021, 155: 1-20. [3] 黄雅楠, 魏立力. 基于相似度的三角模糊数Fisher线性判别分析[J]. 计算机工程, 2018, 44(8): 38-42. https://www.cnki.com.cn/Article/CJFDTOTAL-JSJC201808007.htmHUANG Y N, WEI L L. Similarity-based Fisher linear discriminant analysis for triangular fuzzy number[J]. Computer Enginnering, 2018, 44(8): 38-42(in Chinese). https://www.cnki.com.cn/Article/CJFDTOTAL-JSJC201808007.htm [4] 王惠文, 陈梅玲, Gilbert Saporta. 基于Gram-Schmidt过程的判别变量筛选方法[J]. 北京航空航天大学学报, 2011, 37(8): 958-961. https://bhxb.buaa.edu.cn/CN/Y2011/V37/I8/958WANG H W, CHEN M L, SAPORTA G. Variable selection in discriminant analysis based on Gram-Schmidt process[J]. Journal of Beijing University of Aeronautics and Astronautics, 2011, 37(8): 958-961(in Chinese). https://bhxb.buaa.edu.cn/CN/Y2011/V37/I8/958 [5] MAHALANOBIS P C. On the generalized distance in statistics[J]. Proceedings of the National Institute of Sciences of India, 1936, 2(1): 49-55. [6] 史骏, 陈才扣. 基于马氏距离的半监督鉴别分析及人脸识别[J]. 北京航空航天大学学报, 2011, 37(12): 1589-1593. https://bhxb.buaa.edu.cn/CN/Y2011/V37/I12/1589SHI J, CHEN C K. Mahalanobis distance-based semi-supervised discriminant analysis for face recognition[J]. Journal of Beijing University of Aeronautics and Astronautics, 2011, 37(12): 1589-1593(in Chinese). https://bhxb.buaa.edu.cn/CN/Y2011/V37/I12/1589 [7] DE MAESSCHALCK R, JOUAN-RIMBAUD D, MASSART D L. The Mahalanobis distance[J]. Chemometrics and Intelligent Laboratory Systems, 2000, 50(1): 1-18. doi: 10.1016/S0169-7439(99)00047-7 [8] 梅江元. 基于马氏距离的度量学习算法研究及应用[D]. 哈尔滨: 哈尔滨工业大学, 2016: 7-15.MEI J Y. Research on Mahalanobis distance based metric learning algorithm and its applications[D]. Harbin: Harbin Institute of Technology, 2016: 7-15(in Chinese). [9] CUDNEY E A F, RAGSDELL K M. Forecasting using the Mahalanobis-Taguchi system in the presence of collinearity[R]. [S. l. ]: SAE Technical Paper, 2006. [10] 陶建波, 程龙生. 基于岭估计的岭马田系统在复共线性数据中的应用[J]. 数学的实践与认识, 2016, 46(4): 109-116. https://www.cnki.com.cn/Article/CJFDTOTAL-SSJS201604012.htmTAO J B, CHENG L S. The application of ridge Mahalanobis-Taguchi system based on ridge estimation in data with multicollinearity[J]. Mathematics in Practice and Theory, 2016, 46(4): 109-116(in Chinese). https://www.cnki.com.cn/Article/CJFDTOTAL-SSJS201604012.htm [11] 丁坤, 刘振飞, 高列, 等. 基于主成分分析和马氏距离的光伏系统健康状态研究[J]. 可再生能源, 2017, 35(1): 1-7. https://www.cnki.com.cn/Article/CJFDTOTAL-NCNY201701001.htmDING K, LIU Z F, GAO L, et al. Research on photovoltaic system health state based on PCA-MD method[J]. Renewable Energy Resources, 2017, 35(1): 1-7(in Chinese). https://www.cnki.com.cn/Article/CJFDTOTAL-NCNY201701001.htm [12] 谢吉伟, 刘君强, 王小磊. 基于马氏距离的航空发动机健康监控方法[J]. 航空计算技术, 2015, 45(3): 72-75. doi: 10.3969/j.issn.1671-654X.2015.03.018XIE J W, LIU J Q, WANG X L. Aero-engines health monitoring method based on Mahalanobis distance[J]. Aeronautical Computing Technique, 2015, 45(3): 72-75(in Chinese). doi: 10.3969/j.issn.1671-654X.2015.03.018 [13] JOHNSON R A, WICHERN D W. Applied multivariate statistical analysis[M]. 6th ed. New York: Pearson, 2007: 445. [14] CHOI B Y, TAYLOR J, TIBSHIRANI R. Selecting the number of principal components: Estimation of the true rank of a noisy matrix[J]. The Annals of Statistics, 2017, 45(6): 2590-2617. [15] FORKMAN J, JOSSE J, PIEPHO H P. Hypothesis tests for principal component analysis when variables are standardized[J]. Journal of Agricultural, Biological and Environmental Statistics, 2019, 24: 289-308. doi: 10.1007/s13253-019-00355-5 [16] VIRTA J, NORDHAUSEN K. Estimating the number of signals using principal component analysis[J]. Stat, 2019, 8(1): e231. [17] HASTIE T, TIBSHIRANI R, FRIEDMAN J. The elements of statistical learning[M]. 2nd ed. Berlin: Springer, 2009: 232-249. [18] JOSSE J, HUSSON F. Selecting the number of components in PCA using cross-validation approximations[J]. Computational Statistics & Data Analysis, 2012, 56: 1869-1879. [19] KIERS H A L. Weighted least squares fitting using ordinary least squares algorithms[J]. Psychometrica, 1997, 62(2): 251-266. doi: 10.1007/BF02295279 [20] JOSSE J, PAGÈS J, HUSSON F. Gestion des données manquantes en analyse en composantes principales[J]. Journal de la Société Française de Statistiques, 2009, 150: 28-51. -

 下载:
下载:

 点击查看大图
计量
- 文章访问数: 310
- HTML全文浏览量: 40
- PDF下载量: 59
- 被引次数: 0
