


Multi-source remote sensing image classification based on Transformer and dynamic 3D-convolution
-
摘要:
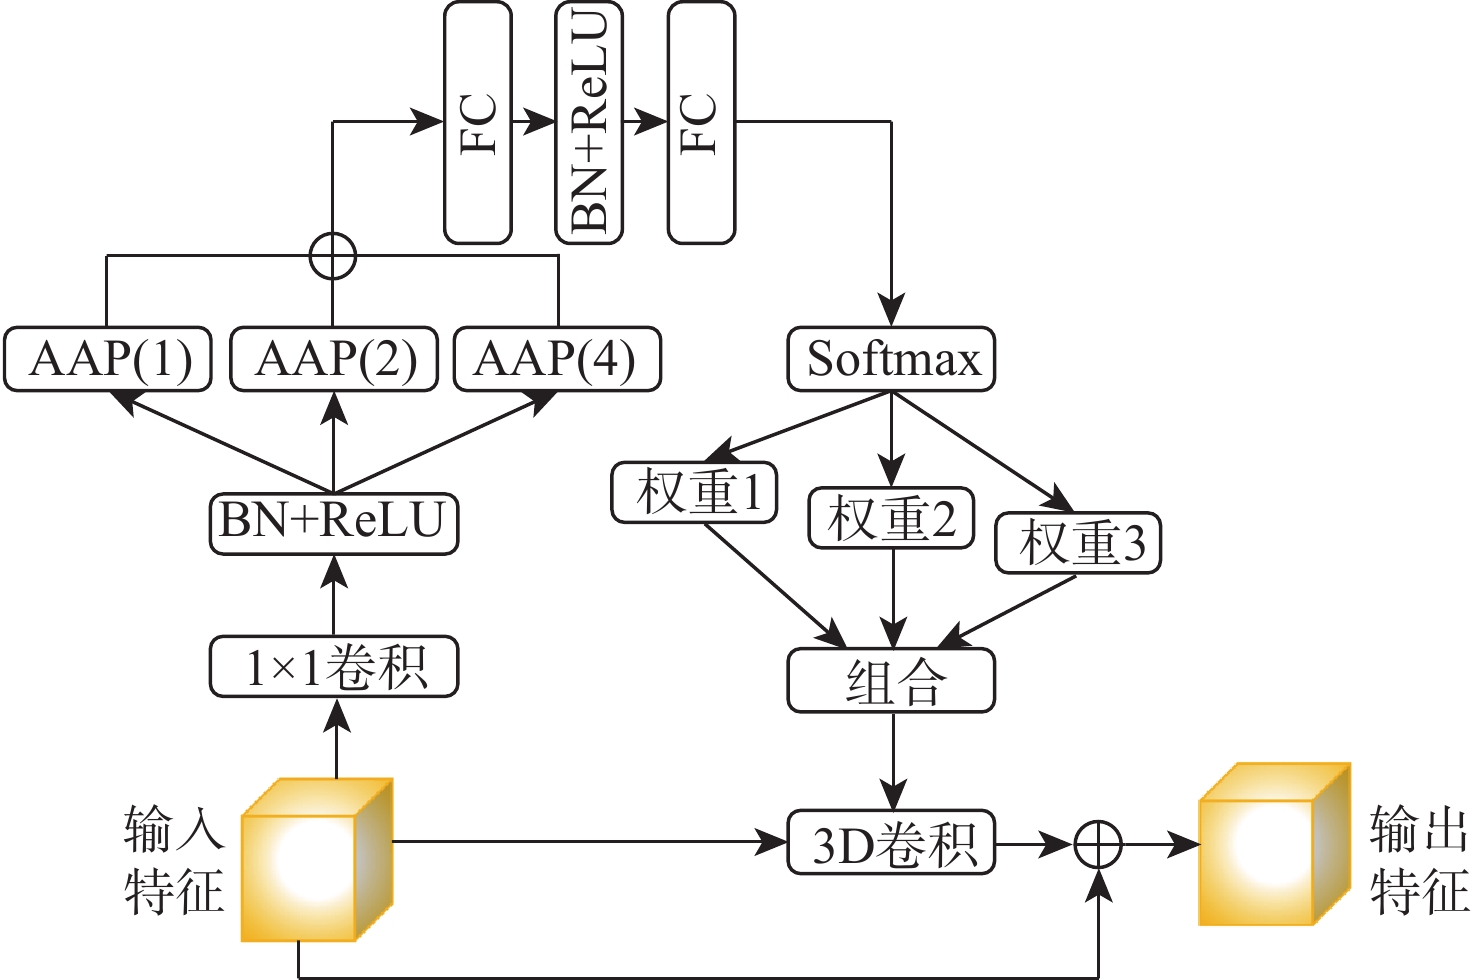
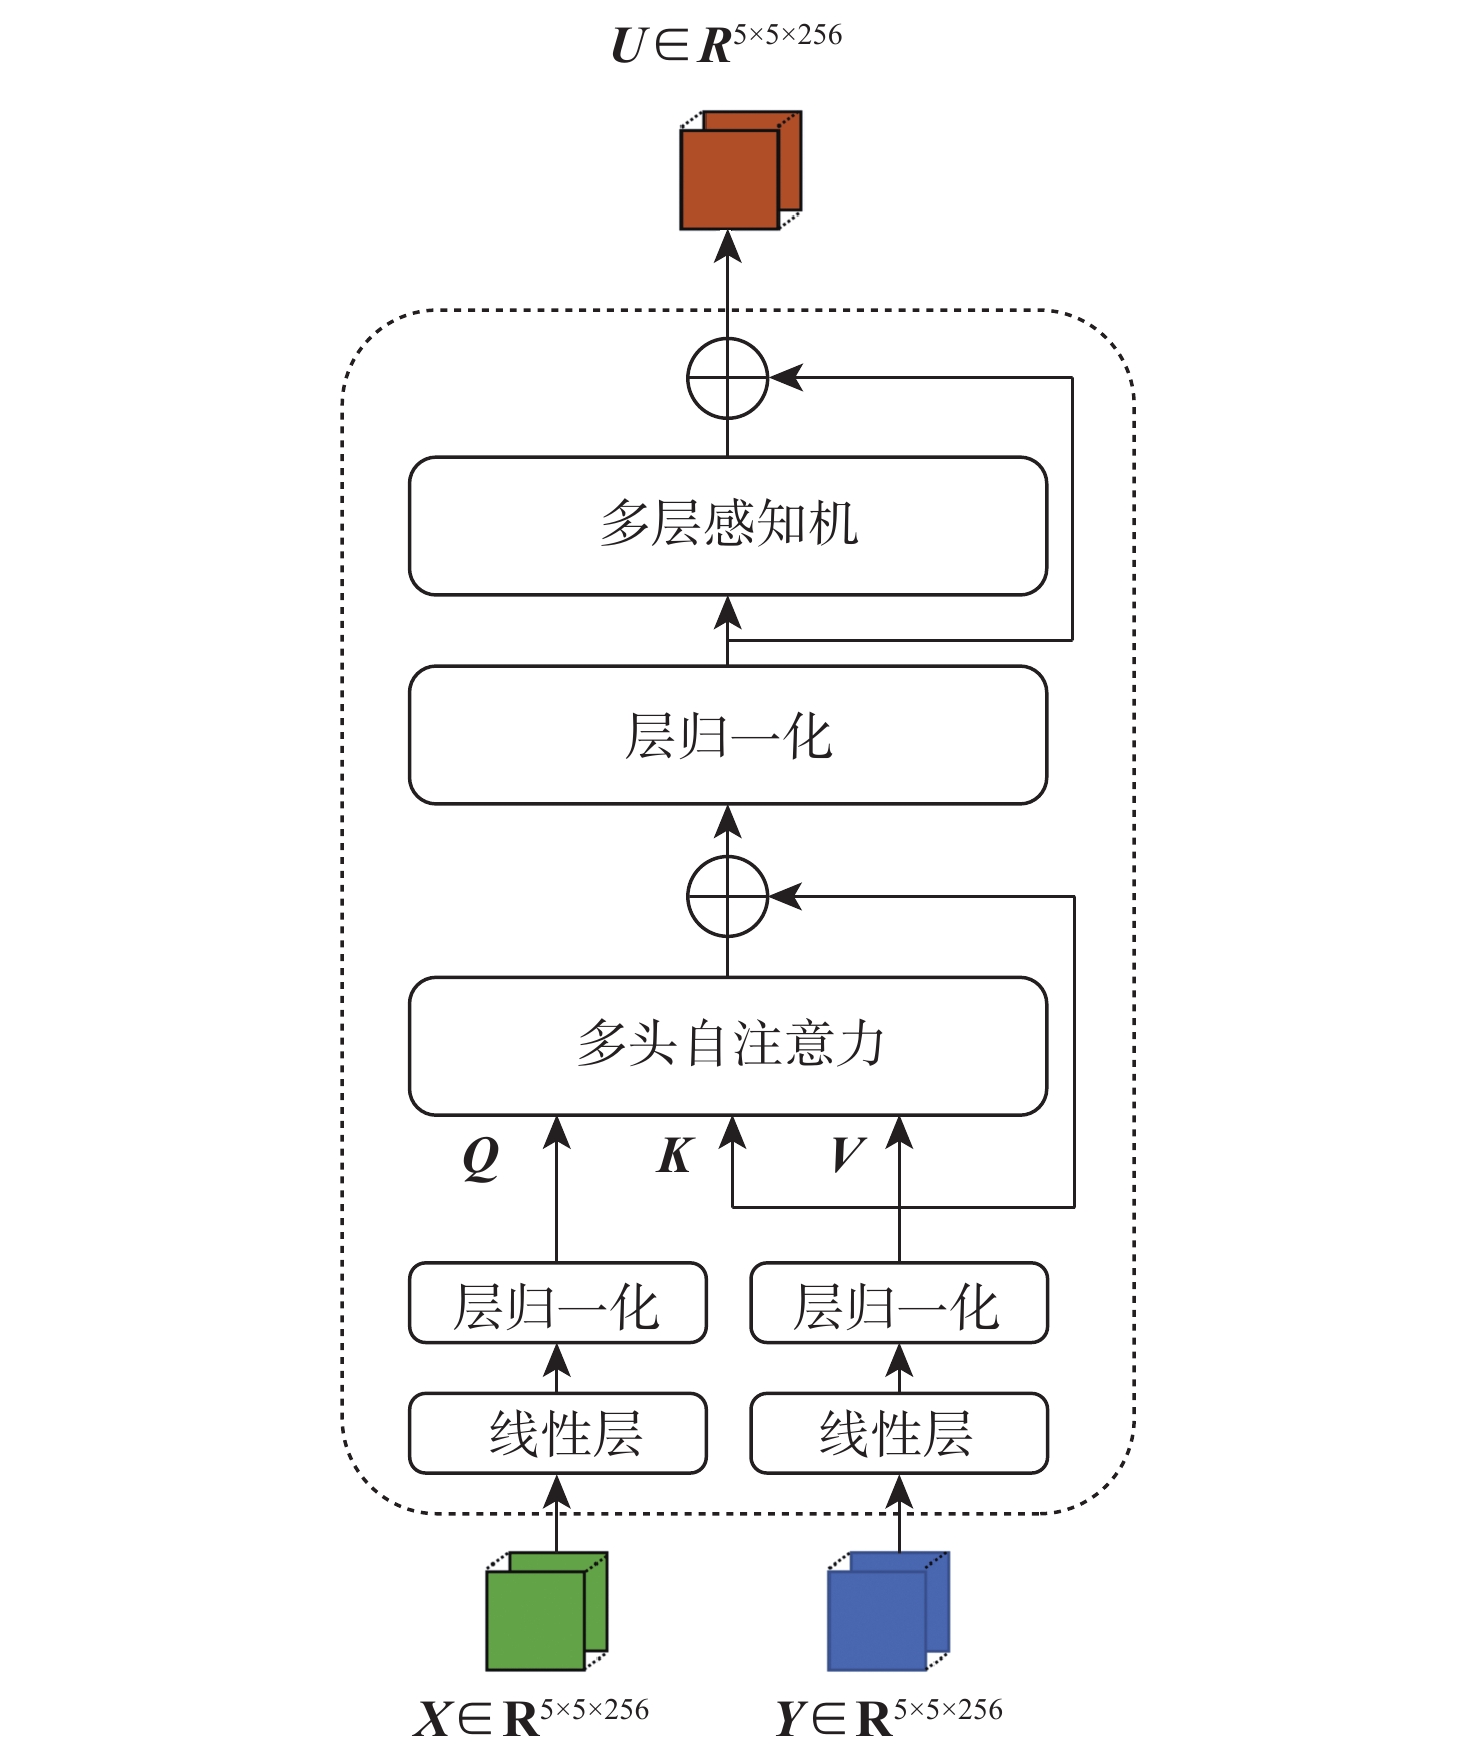
多源遥感数据具有互补性和协同性,近年来,基于深度学习的方法已经在多源遥感图像分类中取得了一定进展,但当前方法仍面临关键难题,如多源遥感图像特征表达不一致,融合困难,基于静态推理范式的神经网络缺乏对不同类别地物的适应性。为解决上述问题,提出了基于跨模态Transformer和多尺度动态3D卷积的多源遥感图像分类模型。为提高多源特征表达的一致性,设计了基于Transformer的融合模块,借助其强大的注意力建模能力挖掘高光谱和LiDAR数据特征之间的相互作用;为提高特征提取方法对不同地物类别的适应性,设计了多尺度动态3D卷积模块,将输入特征的多尺度信息融入卷积核的调制,提高卷积操作对不同地物的适应性。采用多源遥感数据集Houston和Trento对所提方法进行验证,实验结果表明:所提方法在Houston和Trento数据集上总体准确率分别达到94.60%和98.21%,相比MGA-MFN等主流方法,总体准确率分别至少提升0.97%和0.25%,验证了所提方法可有效提升多源遥感图像分类的准确率。
-
关键词:
- 高光谱图像 /
- 激光雷达 /
- Transformer /
- 多源特征融合 /
- 动态卷积
Abstract:Benefited from the complementarity and synergy of multi-source remote sensing data, deep learning-based methods have made significant progress in remote sensing image classification in recent years. Building a powerful multi-source data joint classification model is typically difficult for the following reasons: the feature fusion is hampered by the heterogeneous gap between HSI and LiDAR data; the representation power, efficiency, and interpretability are constrained by the current static inference paradigm.To solve both problems, we propose a Transformer-based fusion network. Specifically, to bridge the heterogeneous gap between HSI and LiDAR data, we design a feature fusion module based on Transformer to exploit the feature interactions between multi-source data. After that, we create a multi-scale dynamic 3D-convolution module to collect the information from different scales and use it to modulate the 3D-convolution kernel. The method was validated with Houston and Trento datasets. The overall accuracy of the proposed method reached 94.60% and 98.21% respectively. Compared with mainstream methods such as MGA-MFN, the overall accuracy of the two datasets was improved by at least 0.97% and 0.25% respectively. The experimental results demonstrate that our method can effectively improve the accuracy of multi-source remote sensing image classification.
-

图 1 基于跨模态Transformer和多尺度动态3D卷积的多源遥感图像融合分类框架
Figure 1. Multi-source remote sensing image fusion classification framework based on cross-modal Transformer and multi-scale dynamic 3D-convolution

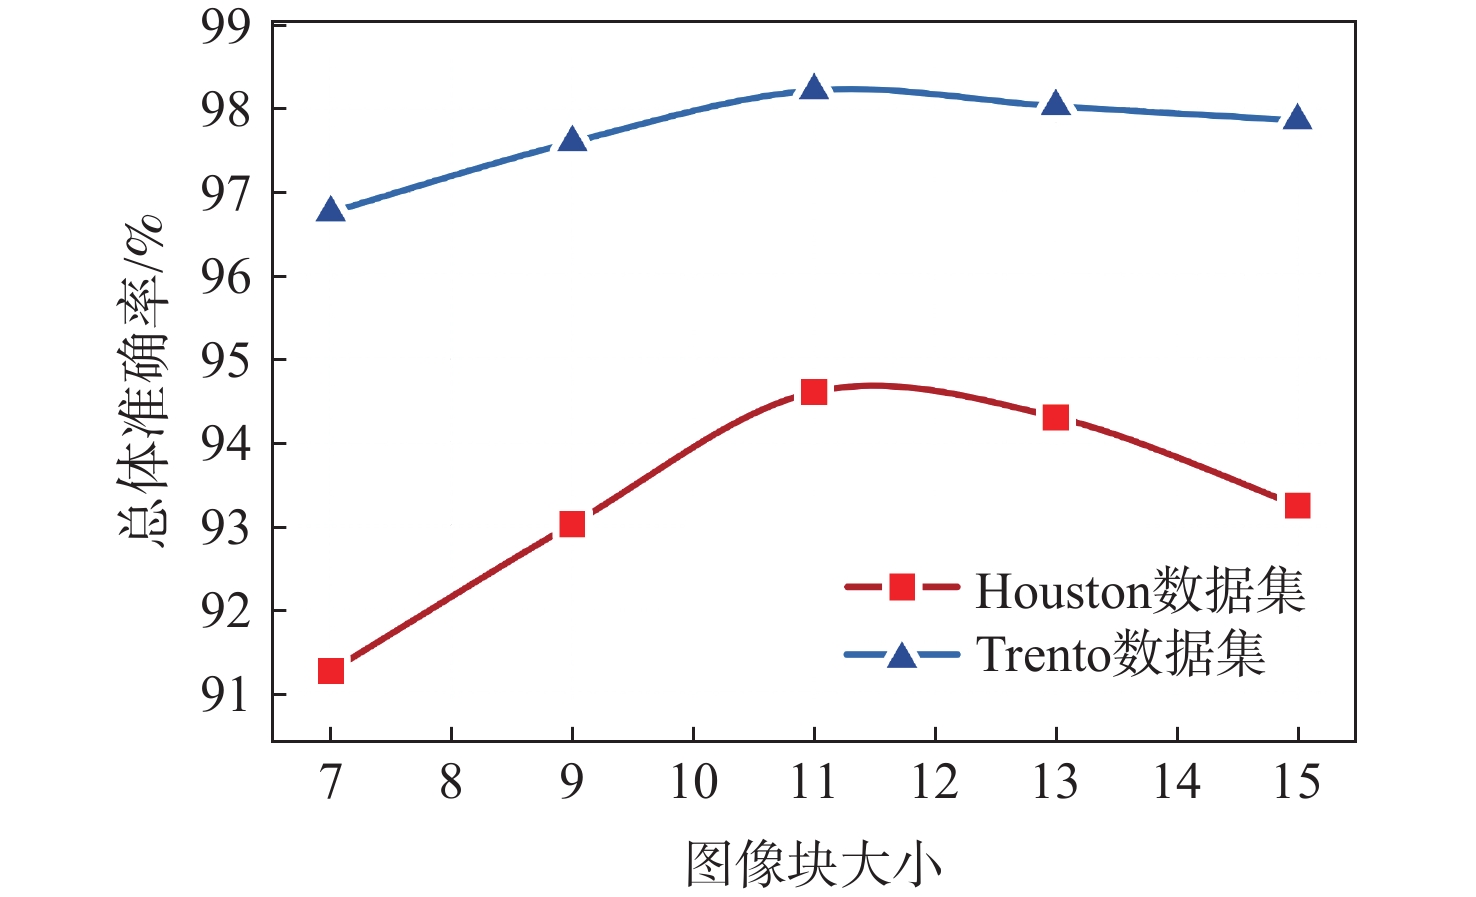
图 4 不同图像块大小与总体准确率的关系
Figure 4. Relationship between different image block sizes and overall accuracy

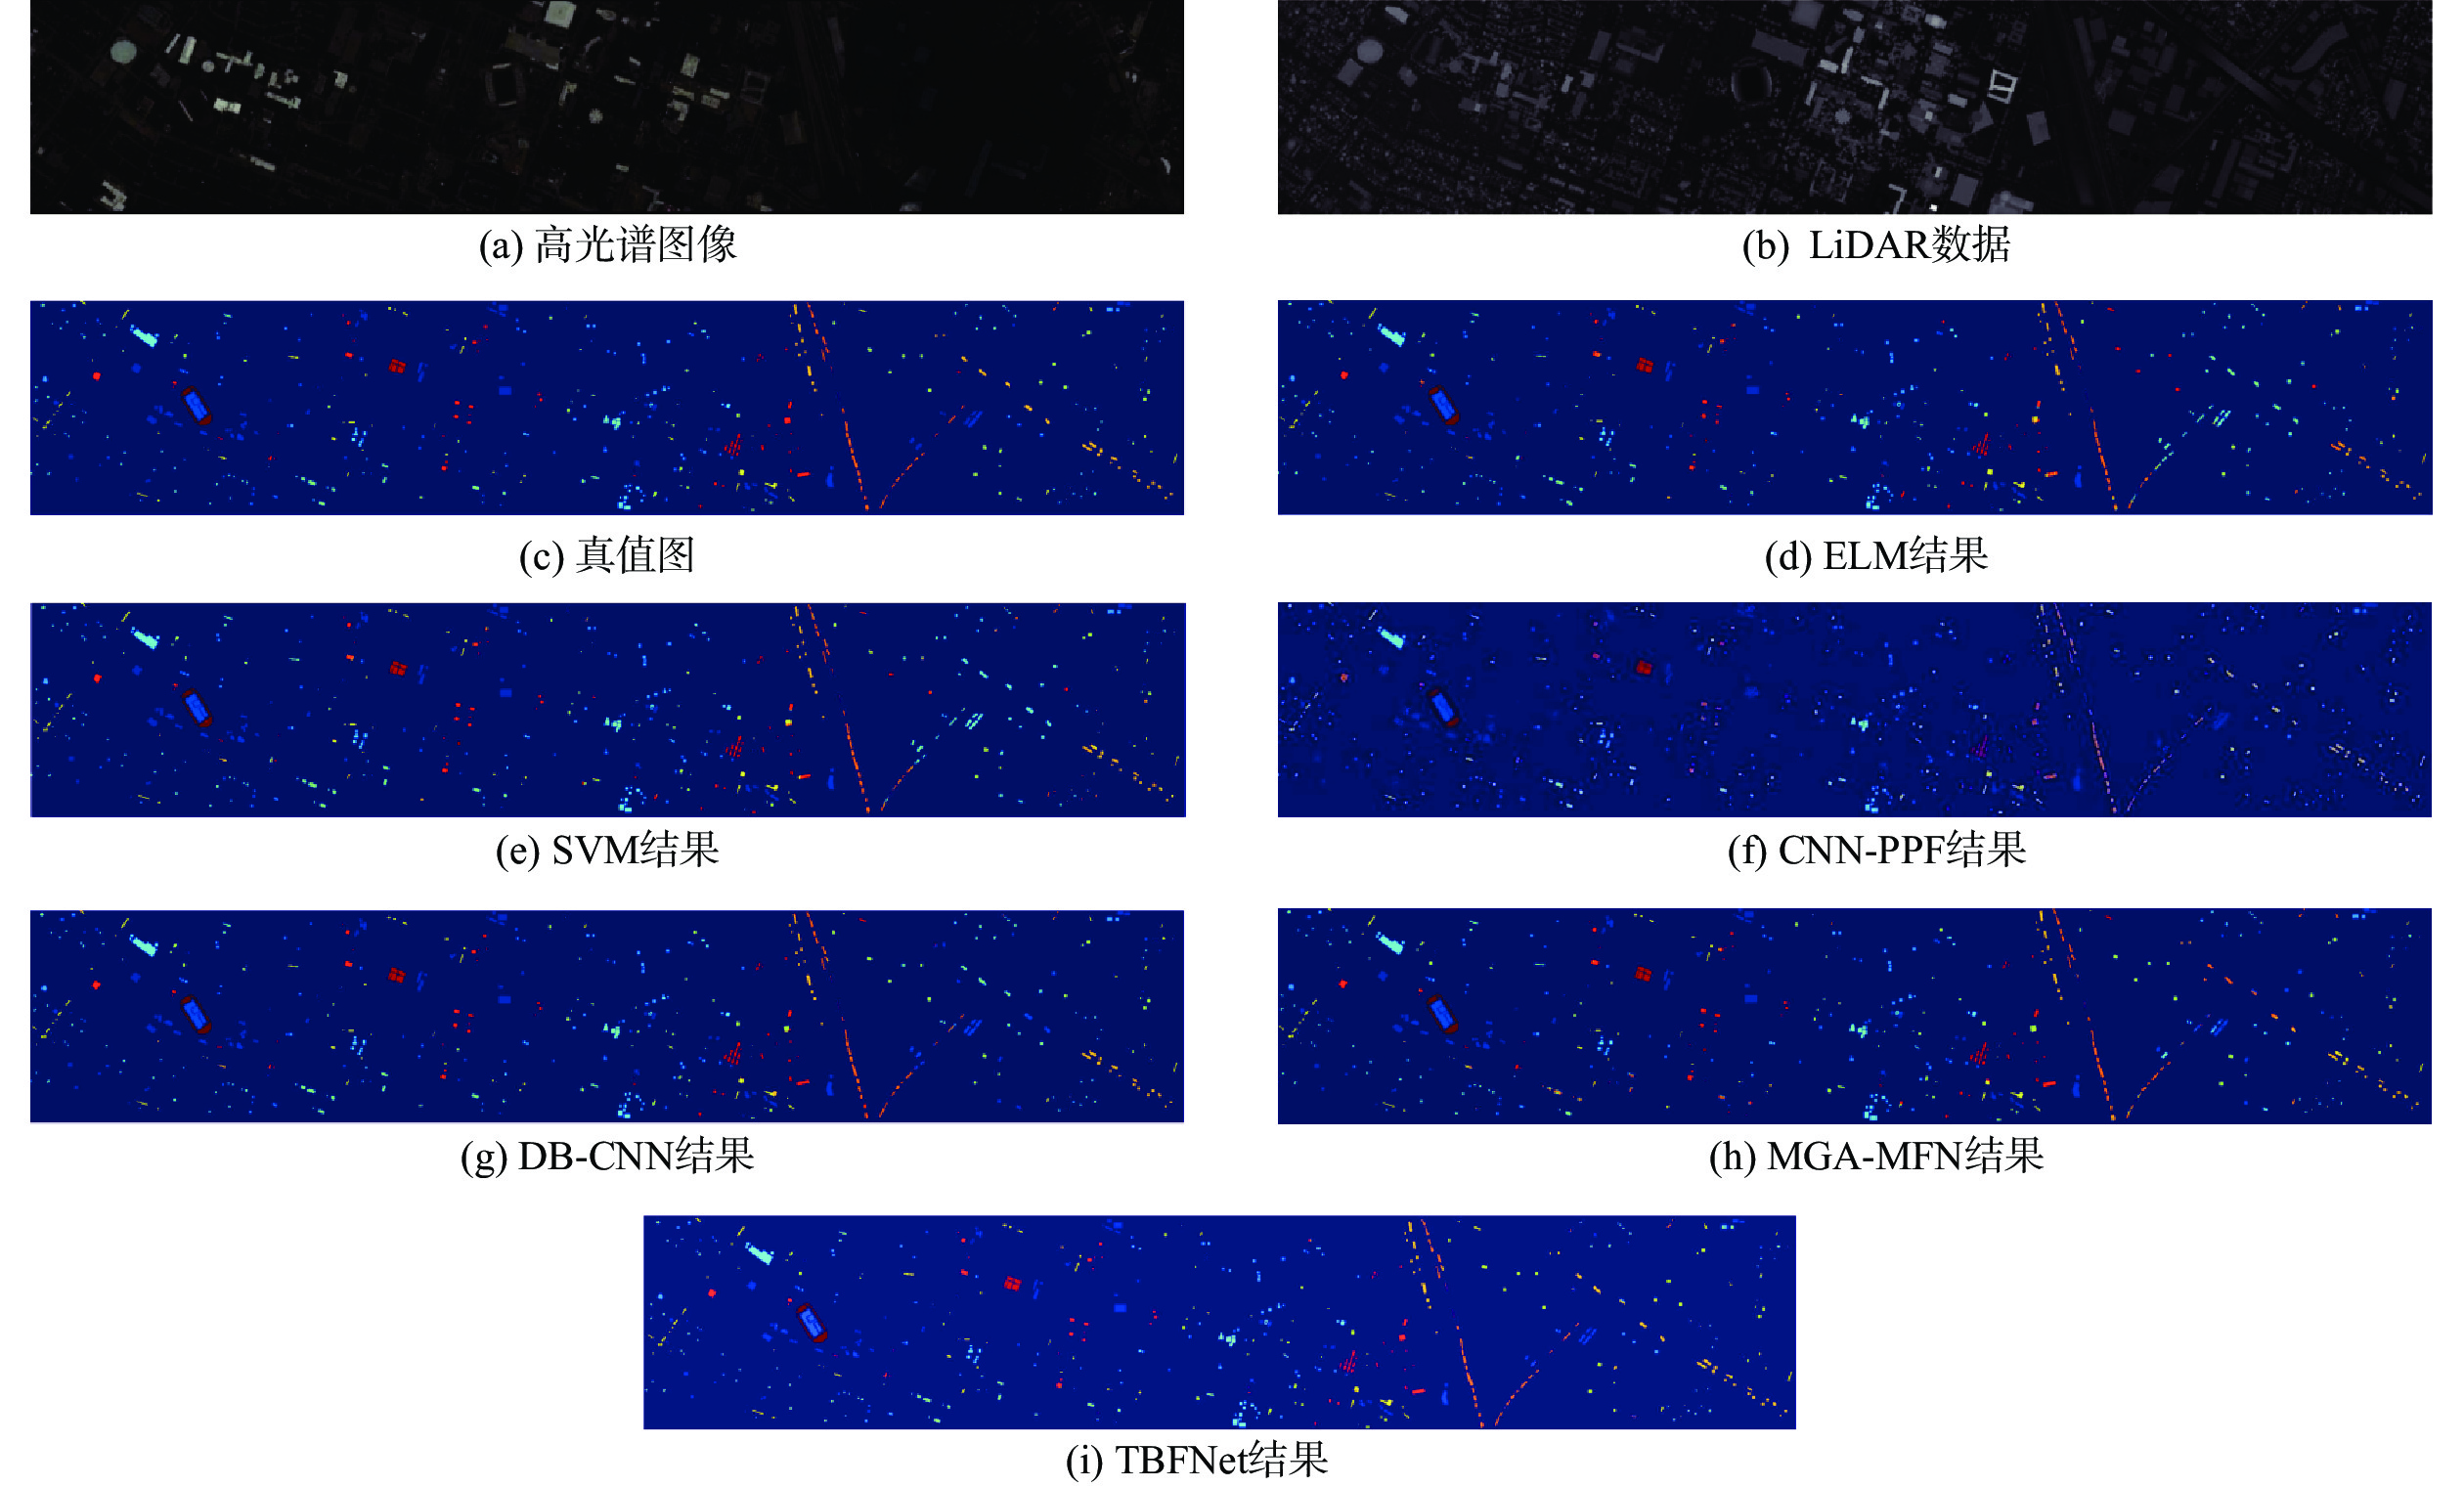
图 5 Houston数据集上不同方法的分类结果
Figure 5. Classification results of different classification methods on Houston dataset

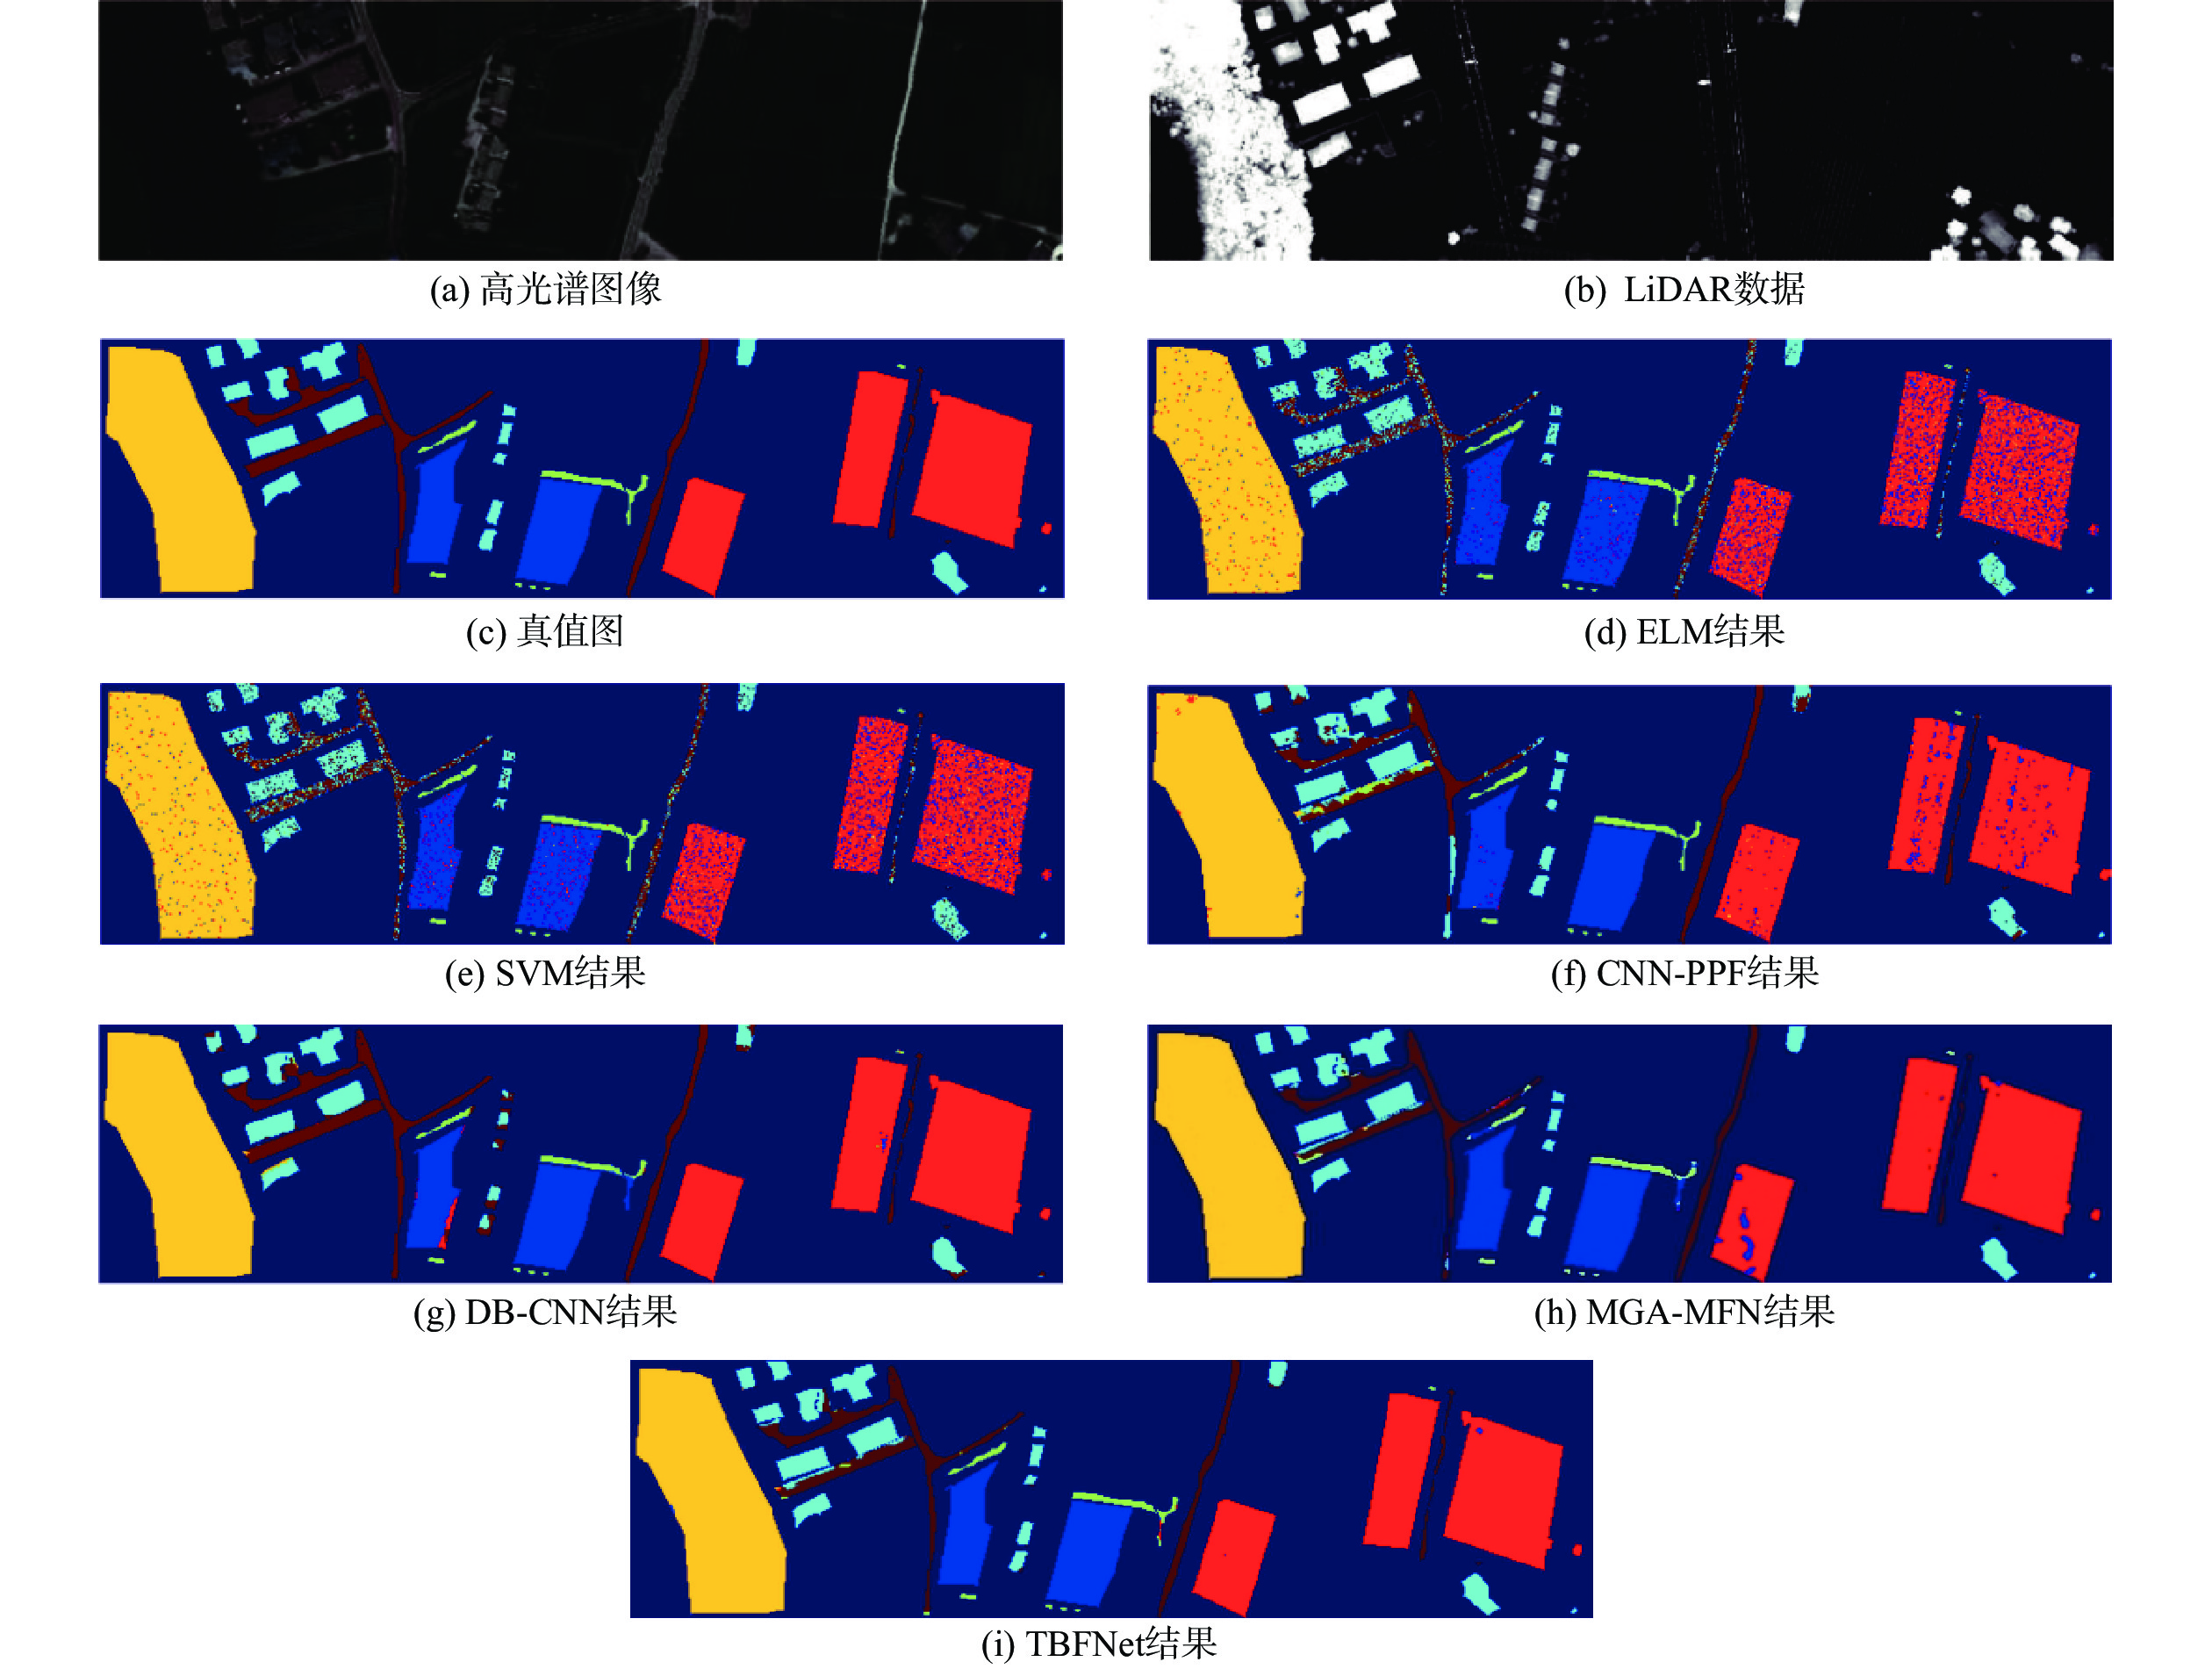
图 6 Trento数据集上不同方法的分类结果
Figure 6. Classification results of different classification methods on Trento dataset
表 1 基于Transformer的融合模块与多尺度动态3D卷积消融实验结果
Table 1. Ablation experiments results of Transformer-based fusion module and multi-scale dynamic 3D-convolution
方法 总体准确率/% Houston数据集 Trento数据集 普通3D卷积 92.12 96.98 动态3D卷积 92.56 97.25 普通3D卷积+Transformer 93.43 97.89 动态3D卷积+Transformer 94.60 98.21  下载: 导出CSV
表 2 Transformer融合器不同输入特征实验结果
Table 2. Experimental results of different input features for Transformer fusion crafting
数据集 特征${\boldsymbol{X}}$ 特征${\boldsymbol{Y}}$ 总体准确率/% Houston 无 无 90.20 LiDAR 高光谱 92.56 高光谱 LiDAR 94.60 Trento 无 无 97.25 LiDAR 高光谱 98.06 高光谱 LiDAR 98.21
下载: 导出CSV
表 3 Houston数据集上不同分类方法的准确率
Table 3. Accuracy of different classification methods on Houston dataset
% 方法 Health grass
(198/1053)Stressed grass
(190/1064)Synthetic grass
(192/505)Trees
(188/1056)Soil
(186/1056)Water
(182/143)Residential
(196/1072)Commercial
(191/1053)ELM 83.10 83.70 100.0 91.86 98.86 95.10 80.04 68.47 SVM 82.43 82.05 99.80 92.80 98.48 95.10 75.47 46.91 CNN-PPF 83.57 98.21 98.42 97.73 96.50 97.20 85.82 56.51 DB-CNN 83.10 84.10 100.0 93.09 100.0 99.30 92.82 82.34 MGA-MFN 94.21 90.70 100.0 99.81 100.0 100.0 86.29 96.58 TBFNet 99.76 82.44 100.0 93.23 98.69 98.56 90.93 97.30 方法 Road
(193/1059)Highway
(191/1036)Railway
(181/1054)Parking lot 1
(192/1041)Parking lot 2
(184/285)Tennis court
(181/247)Running track
(187/473)ELM 84.80 49.13 80.27 79.06 71.58 99.60 98.52 SVM 77.53 60.04 81.02 85.49 75.09 100.0 98.31 CNN-PPF 71.20 57.12 80.55 62.82 63.86 100.0 98.10 DB-CNN 84.70 65.44 88.24 89.53 92.28 96.76 99.79 MGA-MFN 85.84 81.27 96.20 97.50 92.88 100.0 100.0 TBFNet 95.35 93.90 95.31 95.73 97.35 99.60 99.58 注:类别后括号中数字表示训练样本数和测试样本数。
下载: 导出CSV
表 4 Houston数据集上不同分类方法的性能比较
Table 4. Performance comparison of different classification methods on Houston dataset
% 方法 总体准确率 平均准确率 Kappa系数 ELM 81.92 84.27 80.45 SVM 80.49 83.37 78.98 CNN-PPF 83.33 83.21 81.88 DB-CNN 87.98 90.11 86.98 MGA-MFN 93.63 94.71 93.08 TBFNet 94.60 95.10 94.13
下载: 导出CSV
表 5 Trento数据集上不同分类方法的性能比较
Table 5. Performance comparison of different classification methods on Trento dataset
% 方法 准确率 总体
准确率平均
准确率Kappa
系数Apple trees
(129/3905)Buildings
(125/2778)Ground
(105/374)Woods
(154/8969)Vineyard
(184/10317)Roads
(122/3052)ELM 95.81 96.97 96.66 99.39 82.24 86.52 91.32 92.93 90.42 SVM 88.62 94.04 93.53 98.90 88.96 91.75 92.77 92.63 95.85 CNN-PPF 90.11 83.34 71.13 99.04 99.37 89.73 94.76 88.97 93.04 DB-CNN 98.07 95.21 93.32 99.93 98.78 89.98 97.92 96.19 96.81 MGA-MFN 93.78 92.71 76.42 100 99.70 98.29 97.96 93.77 97.27 TBFNet 94.28 93.70 79.80 99.90 99.94 99.82 98.21 95.83 97.61 注:类别后括号中数字表示训练样本数和测试样本数。
下载: 导出CSV
表 6 融合方式对比实验
Table 6. Comparative experiments of different fusion methods
特征融合方式 参数量/106 乘法-累加
运算次数/106总体准确率/% Houston
数据集Trento
数据集Transformer融合 1.9 73.2 94.60 98.21 分解双线性池化 1.5 69.8 93.56 97.75 拼接-卷积 1.5 60.1 93.05 97.73
下载: 导出CSV
-
[1] UEZATO T, FAUVEL M, DOBIGEON N. Hyperspectral image unmixing with LiDAR data-aided spatial regularization[J]. IEEE Transactions on Geoscience and Remote Sensing, 2018, 56(7): 4098-4108. doi: 10.1109/TGRS.2018.2823419 [2] WEI W, ZHANG J, ZHANG L, et al. Deep cube-pair network for hyperspectral imagery classification[J]. Remote Sensing, 2018, 10(5): 1-18. doi: 10.3390/rs10050783 [3] MERENTITIS A, DEBES C, HEREMANS R. Ensemble learning in hyperspectral image classification: Toward selecting a favorable bias-variance tradeoff[J]. IEEE Journal of Selected Topics in Applied Earth Observations and Remote Sensing, 2014, 7(4): 1089-1102. doi: 10.1109/JSTARS.2013.2295513 [4] RASTI B, GHAMISI P, GLOAGUEN R. Hyperspectral and LiDAR fusion using extinction profiles and total variation component analysis[J]. IEEE Transactions on Geoscience and Remote Sensing, 2017, 55(7): 3997-4007. doi: 10.1109/TGRS.2017.2686450 [5] 曹琼, 马爱龙, 钟燕飞, 等. 高光谱-LiDAR 多级融合城区地表覆盖分类[J]. 遥感学报, 2019, 23(5): 892-903.CAO Q, MA A L, ZHONG Y F, et al. Urban classification by multi-feature fusion of hyperspectral image and LiDAR data[J]. Journal of Remote Sensing, 2019, 23(5): 892-903(in Chinese). [6] GE C, DU Q, LI W, et al. Hyperspectral and LiDAR data classification using kernel collaborative representation based residual fusion[J]. IEEE Journal of Selected Topics in Applied Earth Observations and Remote Sensing, 2019, 12(6): 1963-1973. doi: 10.1109/JSTARS.2019.2913206 [7] HANG R, LI Z, GHAMISI P, et al. Classification of hyperspectral and LiDAR data using coupled CNNs[J]. IEEE Transactions on Geoscience and Remote Sensing, 2020, 58(7): 4939-4950. doi: 10.1109/TGRS.2020.2969024 [8] ZHANG T, XIAO S, DONG W, et al. A mutual guidance attention-based multi-level fusion network for hyperspectral and LiDAR classification[J]. IEEE Geoscience and Remote Sensing Letters, 2022, 19: 1-5. [9] LIAO W, PIŽURICA A, BELLENS R, et al. Generalized graph-based fusion of hyperspectral and LiDAR data using morphological features[J]. IEEE Geoscience and Remote Sensing Letters, 2015, 12(3): 552-556. doi: 10.1109/LGRS.2014.2350263 [10] XUE Z, YU X, TAN X, et al. Multiscale deep learning network with self-calibrated convolution for hyperspectral and LiDAR data collaborative classification[J]. IEEE Transactions on Geoscience and Remote Sensing, 2022, 60: 1-16. [11] ZHANG M, LI W, TAO R, et al. Information fusion for classification of hyperspectral and LiDAR data using IP-CNN[J]. IEEE Transactions on Geoscience and Remote Sensing, 2022, 60: 1-12. [12] ZHAO X, TAO R, LI W, et al. Fractional Gabor convolutional network for multisource remote sensing data classification[J]. IEEE Transactions on Geoscience and Remote Sensing, 2022, 60: 1-18. [13] DOSOVITSKIY A, BEYER L, KOLESNIKOV A, et al. An image is worth 16×16 words: Transformers for image recognition at scale[C]//Proceedings of the 9th Interbational Conference on Learning Representations. Schloss Dagstuhl: ICLR, 2021: 1-22. [14] YANG B, BENDER G, LE Q V, et al. CondConv: Conditionally parameterized convolutions for efficient inference[C]//Proceedings of the 32nd International Conference on Neural Infomation Processing Systems. New York: ACM, 2019: 1-15. [15] CHEN Y, DAI X, LIU M, et al. Dynamic convolution: Attention over convolution kernels[C]//Proceedings of the IEEE/CVF Conference on Computer Vision and Pattern Recognition. Piscataway: IEEE Press, 2020: 11027-11036. [16] HU J, SHEN L, ALBANIE S, et al. Squeeze-and-excitation networks[J]. IEEE Transactions on Pattern Analysis and Machine Intelligence, 2020, 42(8): 2011-2023. doi: 10.1109/TPAMI.2019.2913372 [17] LI W, WU G, ZHANG F, et al. Hyperspectral image classification using deep pixel-pair features[J]. IEEE Transactions on Geoscience and Remote Sensing, 2017, 55(2): 844-853. [18] XU X, LI W, RAN Q, et al. Multisource remote sensing data classification based on convolutional neural network[J]. IEEE Transactions on Geoscience and Remote Sensing, 2018, 56(2): 937-949. doi: 10.1109/TGRS.2017.2756851 [19] YU Z, YU J, FAN J, et al. Multi-modal factorized bilinear pooling with co-attention learning for visual question answering[C]//Proceedings of the IEEE International Conference on Computer Vision. Piscataway: IEEE Press, 2017: 1821-1830. -

 下载:
下载:

 点击查看大图

计量
- 文章访问数: 1023
- HTML全文浏览量: 171
- PDF下载量: 28
- 被引次数: 0
