


-
摘要:
临近空间在科学、经济和军事等领域具有重要价值,高效便捷地进行临近空间数据Web科学可视化和信息提取是临近空间数据应用不断深入和扩展的必然需求,但是,已有的临近空间数据类型繁杂和数据量巨大,成为Web传输和实时可视化的关键瓶颈。从数据组织方法角度展开了研究,根据临近空间数据的特点,结合视频压缩原理,提出了将临近空间数据进行分解、插值和色彩空间变换处理形成图像后,选取适宜视频压缩编码方法将图像编码为视频。实验结果表明:所提方法可以实现临近空间数据在Web环境下的高效组织,在保障可视化质量的前提下通过降低数据网络传输量实现了临近空间数据的实时可视化需求。研究结果可以直接解决临近空间数据Web实时可视化问题,将为临近空间科学研究和知识发现提供可视化理论和技术支持,并为类似海量数据Web科学可视化提供方法借鉴。
Abstract:As a transitional region from sky to space, near-space has important value in the fields of science, economy and military. With the development of remote sensing technology and the continuous development of mode simulation, the massive near-space data of higher spatial and temporal resolution is increasing. On the other hand, efficient and convenient Web scientific visualization and information extraction for near-space data are inevitable requirements for the continuous deepening and expansion of near-space data applications. However, the existing data types are cumbersome and the amount of data is huge in near-space, which becomes the key bottleneck of Web transmission and real-time visualization. This paper focuses on the visualization of near-space data on the Web digital globe, and studies it from the point of data organization methods. According to the characteristics of near-space data, combined with the principle of video compression, we propose to decompose, interpolate and color space transform the near-space data to form an image, and then select the appropriate video compression coding method to encode the image into video. Experiment results show that this method can be implemented efficiently. The video organization of spatial data in the Web environment realizes the real-time visualization of near-space data by reducing the amount of data network transmission while ensuring the quality of visualization. The research results in this paper can directly solve the real-time visualization problem of near-space data on Web, provide visual theory and technical support for the near-space science research and knowledge discovery, and provide a reference for the Web scientific visualization on similar massive data.
-

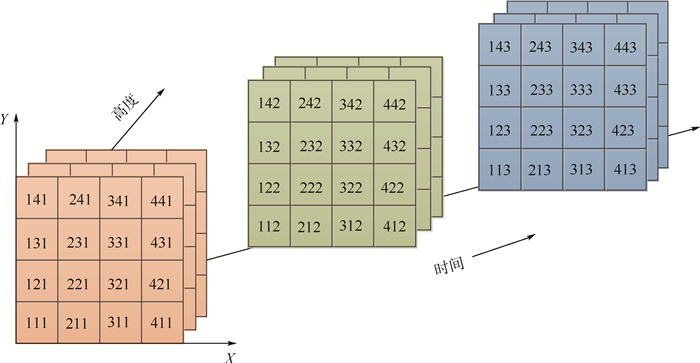
图 2 四维数据(某个区域内随时间和高度变化的数据)
Figure 2. Four-dimensional data (variation of data with time and height within an area)

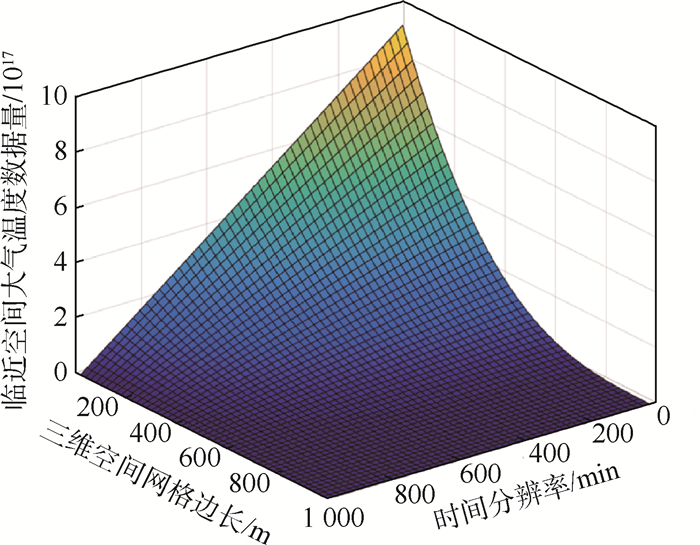
图 3 大气温度数据量随三维空间网格边长及时间分辨率变化
Figure 3. Variation of atmospheric temperature data amount with length of three-dimensional space grid and time resolution

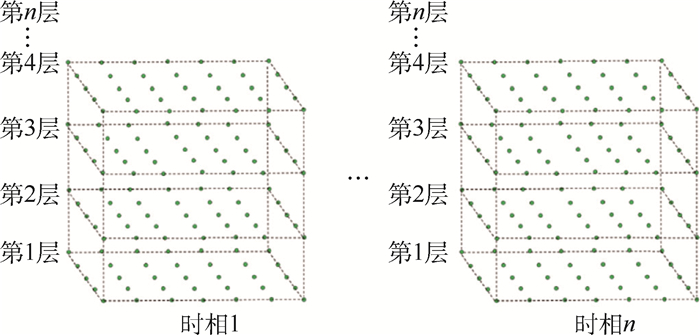
图 4 四维临近空间大气温度数据转换为一系列二维网格示意图
Figure 4. Schematic diagram of four-dimensional near-space atmospheric temperature data being converted to a series of two-dimensional grids

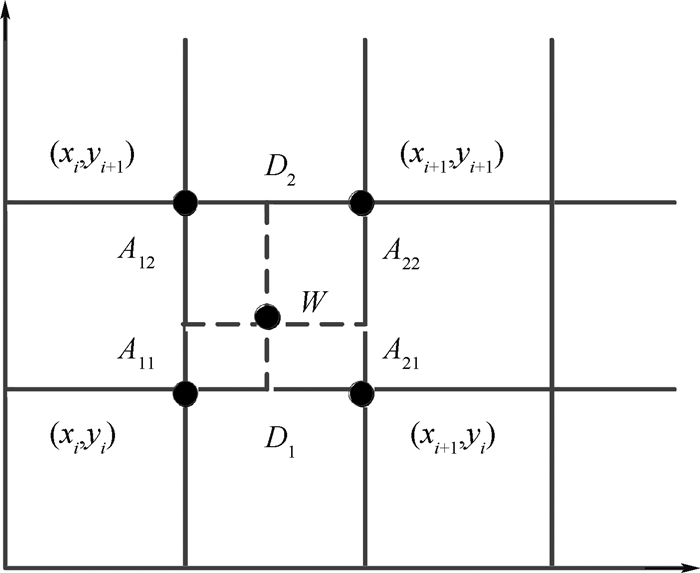
图 5 双线性插值算法原理示意图
Figure 5. Schematic diagram of bilinear interpolation algorithm principle

图 6 临近空间时序大气温度数据特点示意图
Figure 6. Schematic diagram of temporary data characteristics of atmospheric temperature in near-space

图 7 临近空间时序电离层电子总量数据特点示意图
Figure 7. Schematic diagram of temporary data characteristics of ionization-layer electron total amount in near-space

图 8 临近空间时序大气风场数据特点示意图
Figure 8. Schematic diagram of temporary data characteristics of atmospheric wind field in near-space

图 9 代表不同高度层临近空间大气温度的RGB图像
Figure 9. RGB image representing atmospheric temperature of near-space at different height levels

图 10 代表某时相临近空间大气温度的多层RGB图像
Figure 10. Multi-layer RGB image representing atmospheric temperature of near-space in a certain time phase

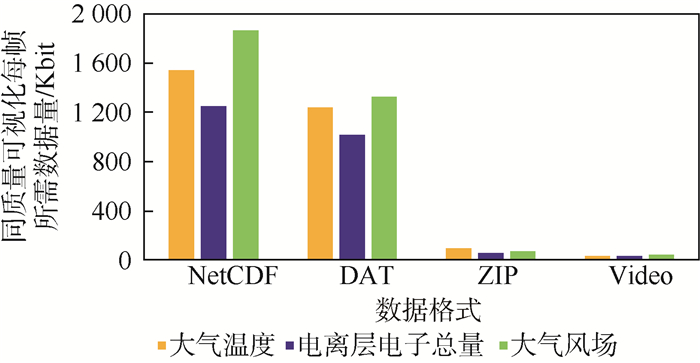
图 11 同质量可视化不同数据格式下的数据传输量对比
Figure 11. Comparison of data transmission volume under different data formats with the same quality visualization

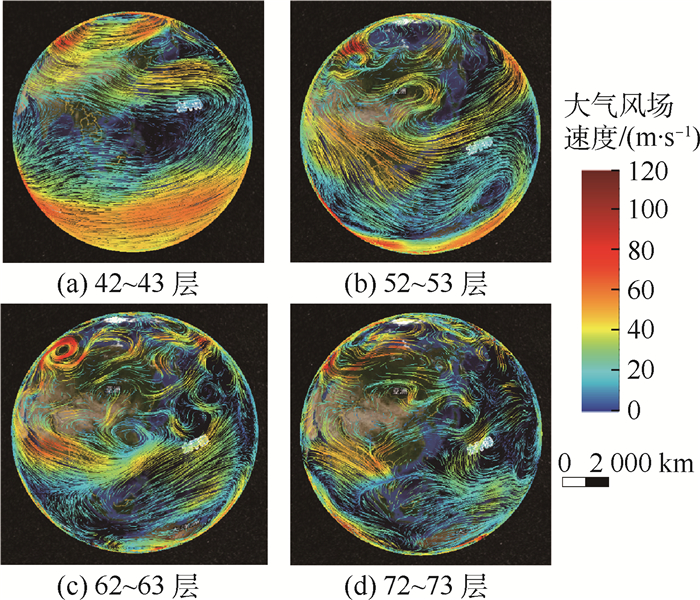
图 12 不同高度层临近空间大气风场绘制结果(流线数量:128×128)
Figure 12. Rendering results of atmospheric wind field in near-space at different height levels (number of streamlines: 128×128)

图 13 同一时相不同高度层大气温度光线投射体绘制结果
Figure 13. Atmospheric temperature ray projection volume rendering results at different height levels in the same time phase

图 14 同一高度层不同时相大气温度光线投射体绘制结果
Figure 14. Atmospheric temperature ray projection volume rendering results in different time phases at the same height level

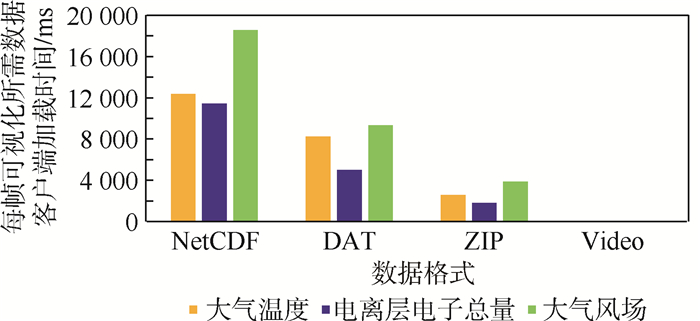
图 15 每帧可视化所需数据客户端加载时间对比
Figure 15. Comparison of visualization data loading time for each frame in client
表 1 不同视频编解码器性能比较
Table 1. Comparison of performance of different video codecs
视频编解码器 解码速度 编码质量 是否支持YUV4:4:4 H.264 良 优 否 VP8 优 良 否 VP9 良 优 是  下载: 导出CSV
表 2 不同色度子采样模型信息保存量比较
Table 2. Comparison of information storage amount of different color sub-sampling models
色度子采样模型 保存信息量 YUV4:2:0 少 YUV4:2:2 中 YUV4:4:4 多
下载: 导出CSV
表 3 典型临近空间数据
Table 3. Typical near-space data
数据属性 大气温度 电离层电子总量 大气风场 数据类型 四维标量 三维标量 四维矢量 数据格式 NetCDF DAT NetCDF 经度范围/(°) -180~179.5 70~140 -180~179.5 纬度范围/(°) -90~90 15~55 -90~90 高度范围/km 20~100 60~100 20~100 起始时刻 2016年12月
21日2时2018年1月
1日1时2016年12月
21日2时结束时刻 2016年12月
30日24时2018年7月
23日24时2016年12月
30日24时经度间隔/(°) 2.5 1 2.5 纬度间隔/(°) 1 高度间隔/km 1 1 时间间隔/h 2 0.25 2 数据量/GB 1.2 0.8 1.5
下载: 导出CSV
表 4 插值处理后典型临近空间数据
Table 4. Typical near-space data after interpolation
数据属性 大气温度 电离层电子总量 大气风场 数据类型 四维标量 三维标量 四维矢量 数据格式 NetCDF DAT NetCDF 经度范围/(°) -180~180 70~140 -180~180 纬度范围/(°) -90~90 15~55 -90~90 高度范围/km 20~100 60~100 20~100 起始时刻 2016年12月
21日2时2018年1月
1日1时2016年12月
21日2时结束时刻 2016年12月
30日24时2018年7月
23日24时2016年12月
30日24时经度间隔/(°) 1 1 1 纬度间隔/(°) 1 1 1 高度间隔/km 1 1 时间间隔/h 2 0.25 2 数据量/GB 2.68 0.8 3.6
下载: 导出CSV
-
[1] 肖存英, 胡雄, 杨钧烽, 等.临近空间38°N大气密度特性及建模技术[J].北京航空航天大学学报, 2017, 43(9):1757-1765. doi: 10.13700/j.bh.1001-5965.2016.0735XIAO C Y, HU X, YANG J F, et al.Atmospheric density characteristics and modeling techniques of near space 38°N[J].Journal of Beijing University of Aeronautics and Astronautics, 2017, 43(9):1757-1765(in Chinese). doi: 10.13700/j.bh.1001-5965.2016.0735 [2] 杨钧烽.中纬度临近空间大气风场变化特性研究[D].北京: 中国科学院国家空间科学中心, 2016.YANG J F.Study on the variation characteristics of atmospheric wind field in the mid-latitude adjacent space[D].Beijing: National Space Science Center, Chinese Academy of Sciences, 2016(in Chinese). [3] 刘涛.临近空间大气风场统计预报方法研究[D].北京: 中国科学院国家空间科学中心, 2017.LIU T.Research on statistical forecast method for atmospheric wind field in adjacent space[D].Beijing: National Space Science Center, Chinese Academy of Sciences, 2017(in Chinese). [4] 邓潘.地基激光雷达对临近空间大气的探测研究[D].合肥: 中国科学技术大学, 2018.DENG P.Ground-based lidar detection of adjacent space atmosphere[D].Hefei: University of Science and Technology of China, 2018(in Chinese). [5] 杨钧烽, 肖存英, 胡雄, 等.临近空间风切变特性及其对飞行器的影响[J].北京航空航天大学学报, 2019, 45(1):57-65. doi: 10.13700/j.bh.1001-5965.2018.0175YANG J F, XIAO C Y, HU X, et al.Wind shear characteristics of adjacent space and its influence on aircraft[J].Journal of Beijing University of Aeronautics and Astronautics, 2019, 45(1):57-65(in Chinese). doi: 10.13700/j.bh.1001-5965.2018.0175 [6] 郭文杰.532 nm瑞利多普勒激光雷达若干关键技术和大气重力波观测研究[D].北京: 中国科学院国家空间科学中心, 2016.GUO W J.Several key technologies of 532 nm Rayleigh Doppler lidar and atmospheric gravity wave observation[D].Beijing: National Space Science Center, Chinese Academy of Sciences, 2016(in Chinese). [7] GOODCHILD M F, GUO H D, ANNONI A, et al.Next-generation digital earth[J].Proceedings of the National Academy of Sciences of the United States of America, 2008, 109(28):11088-11094. http://d.old.wanfangdata.com.cn/Periodical/zgtxtxxb-a199911015 [8] LACROUTE P H, LEVOY M.Fast volume rendering using a shear-warp factorization of the viewing transformation[M].New York:ACM, 1994:451-458. [9] LEVOY M.Display of surfaces from volume data[J].IEEE Computer Graphics and Applications, 1988, 8(3):29-37. http://www.wanfangdata.com.cn/details/detail.do?_type=perio&id=e445047350d0f48aabe2c871e72ad683 [10] SUN X J, SHEN S H, LEPTOUKH G G, et al.Development of a Web-based visualization platform for climate research using Google Earth[J].Computers & Geosciences, 2012, 47:160-168. http://www.wanfangdata.com.cn/details/detail.do?_type=perio&id=cfb2e0db8e89ee1e1cecc3500f4984b2 [11] 吴玲达, 于荣欢, 瞿师.大规模三维标量场并行可视化技术综述[J].系统仿真学报, 2012, 24(1):12-16. http://d.old.wanfangdata.com.cn/Conference/7571335WU L D, YU R H, QU S.Review of large-scale 3D scalar field parallel visualization technology[J].Journal of System Simulation, 2012, 24(1):12-16(in Chinese). http://d.old.wanfangdata.com.cn/Conference/7571335 [12] 谢衍新, 吴小成, 胡雄, 等.临近空间全球温度场三维变分同化[J].红外与激光工程, 2017, 46(8):55-60. http://d.old.wanfangdata.com.cn/Periodical/hwyjggc201708009XIE Y X, WU X C, HU X, et al.Three-dimensional variational assimilation of global temperature field in adjacent space[J].Infrared and Laser Engineering, 2017, 46(8):55-60(in Chinese). http://d.old.wanfangdata.com.cn/Periodical/hwyjggc201708009 [13] 冯健, 甄卫民, 刘钝.电离层环境对地空信息系统的影响效应[J].装备环境工程, 2017, 14(7):7-11. http://d.old.wanfangdata.com.cn/Periodical/jscxgy201707002FENG J, ZHAI W M, LIU D.Effect of ionospheric environment on ground-air information system[J].Equipment Environmental Engineering, 2017, 14(7):7-11(in Chinese). http://d.old.wanfangdata.com.cn/Periodical/jscxgy201707002 [14] 王文涛.非结构化网格分片线性矢量场高效可视化技术研究[D].长沙: 国防科学技术大学, 2016.WANG W T.Research on efficient visualization technology of unstructured grid segmentation linear vector field[D].Changsha: National University of Defense Technology, 2016(in Chinese). [15] 曹柱.基于GPU的海洋水体环境多维可视化技术研究[D].青岛: 中国海洋大学, 2015.CAO Z.GPU-based multi-dimensional visualization technology of marine water environment[D].Qingdao: Ocean University of China, 2015(in Chinese). [16] SUN M, LI J, YANG C W, et al.A Web-based geovisual analytical system for climate studies[J].Future Internet, 2012, 4(4):1069-1085. http://d.old.wanfangdata.com.cn/OAPaper/oai_doaj-articles_8d19d557f02f388621439e8681072be0 [17] SARTHOU A, MAS S, JACQUIN M, et al.EarthScape, a multi-purpose interactive 3D globe viewer for hybrid data visualization and analysis[J].The International Archives of Photogrammetry, Remote Sensing and Spatial Information Sciences, 2015, 40(3):487-493. http://www.wanfangdata.com.cn/details/detail.do?_type=perio&id=Doaj000003949526 [18] LI W W, SONG M M, ZHOU B, et al.Performance improvement techniques for geospatial Web services in a cyberinfrastructure environment-A case study with a disaster management portal[J].Computers, Environment and Urban Systems, 2015, 54:314-325. http://www.wanfangdata.com.cn/details/detail.do?_type=perio&id=f02ebad90dbf52e1f00b59d69b5d2a8e [19] 张凌燕.流媒体服务的OoE计算方法研究[D].北京: 北京邮电大学, 2018.ZHANG L Y.Research on OoE calculation method of streaming media service[D].Beijing: Beijing University of Posts and Telecommunications, 2018(in Chinese). [20] 张志明, 柯卫.基于HTML5的视频通信云服务应用技术研究[J].电信科学, 2012, 28(10):31-37. http://d.old.wanfangdata.com.cn/Periodical/dxkx201210006ZHANG Z M, KE W.Research on application technology of video communication cloud service based on HTML5[J].Telecommunications Science, 2012, 28(10):31-37(in Chinese). http://d.old.wanfangdata.com.cn/Periodical/dxkx201210006 [21] 顾春莲.HTML5中的音频及视频元素对互联网的影响[J].河北省科学院学报, 2011, 28(3):106-108. http://www.wanfangdata.com.cn/details/detail.do?_type=perio&id=hbskxyxb201103025GU C L.The influence of audio and video elements in HTML5 on the Internet[J].Journal of the Hebei Academy of Sciences, 2011, 28(3):106-108(in Chinese). http://www.wanfangdata.com.cn/details/detail.do?_type=perio&id=hbskxyxb201103025 [22] LI W W, WANG S Z.Polarglobe:A Web-wide virtual globe system for visualizing multidimensional, time-varying, big climate data[J].International Journal of Geographical Information Science, 2017, 31(8):1562-1582. http://cn.bing.com/academic/profile?id=245f045818df1d415dbb978aa9f5adec&encoded=0&v=paper_preview&mkt=zh-cn [23] 刘鹤丹.科学计算可视化中三维等值曲面构建方法研究[D].沈阳: 东北大学, 2015.LIU H D.Research on construction method of 3D equivalent surface in scientific computing visualization[D].Shenyang: Northeastern University, 2015(in Chinese). [24] 支星, 徐海明.3种再分析资料的高空温度与中国探空温度资料的对比:年平均特征[J].大气科学学报, 2013, 36(1):77-87. http://d.old.wanfangdata.com.cn/Periodical/njqxxyxb201301009ZHI X, XU H M.Comparison of high altitude temperature and Chinese sounding temperature data of three kinds of reanalysis data:Annual average characteristics[J].Chinese Journal of Atmospheric Sciences, 2013, 36(1):77-87(in Chinese). http://d.old.wanfangdata.com.cn/Periodical/njqxxyxb201301009 [25] POYNTON C. Chroma subsampling notation[EB/OL].San Francisco: Morgan Kaufmann, 2003(2018-01-24)[2019-06-01].http://poynton.ca/PDFs/Chroma_subsampling_notation.pdf. [26] 王少荣, 陈毅松, 汪国平.数字海洋系统的向量场可视化[J].计算机辅助设计与图形学学报, 2016, 28(12):2114-2119. http://d.old.wanfangdata.com.cn/Periodical/jsjfzsjytxxxb201612010WANG S R, CHEN Y S, WANG G P.Vector field visualization of digital ocean system[J].Journal of Computer-Aided Design & Computer Graphics, 2016, 28(12):2114-2119(in Chinese). http://d.old.wanfangdata.com.cn/Periodical/jsjfzsjytxxxb201612010 [27] 李骞, 范茵, 王吉奎.基于粒子追踪的风场可视化方法[J].解放军理工大学学报(自然科学版), 2005, 6(1):89-91. http://d.old.wanfangdata.com.cn/Periodical/jfjlgdxxb200501021LI Q, FAN Y, WANG J K.Visualization method of wind field based on particle tracking[J].Journal of PLA University of Science and Technology(Natural Science Edition), 2005, 6(1):89-91(in Chinese). http://d.old.wanfangdata.com.cn/Periodical/jfjlgdxxb200501021 [28] 陈静, 邹成, 黄吴蒙, 等.面向虚拟地球的三维气象场可视化方法[J].武汉大学学报(信息科学版), 2016, 41(12):1563-1569. http://d.old.wanfangdata.com.cn/Periodical/whchkjdxxb201612001CHEN J, ZOU C, HUANG W M, et al.Visualization of 3D meteorological field for virtual earth[J].Journal of Wuhan University(Information Science Edition), 2016, 41(12):1563-1569(in Chinese). http://d.old.wanfangdata.com.cn/Periodical/whchkjdxxb201612001 -

 下载:
下载:


 点击查看大图
计量
- 文章访问数: 619
- HTML全文浏览量: 115
- PDF下载量: 167
- 被引次数: 0
