





-
摘要:
针对空中交通管制员个体工作负荷承受力差异问题,构建管制员个体工作负荷量化模型。设计实验采集一线24名区域管制员的岗前与岗后各项指标数据,根据测试数据选择出敏感变量对个体负荷进行描述。建立包含心理感知负荷、生理反应负荷与认知工作负荷3个维度的综合评估指标体系,构建了管制员个体工作负荷综合指数模型。通过熵权-CRITIC组合法求解个体负荷指数最优权重,计算每名管制员个体工作负荷指数,发现管制员的个体工作负荷存在明显差异,认知工作负荷是决定管制员个体工作负荷指数大小的关键指标。认知工作负荷与管制员的反应能力、决策能力和搜索能力正相关。为进一步探索影响管制员认知工作负荷增长的原因,计算管制员在5种不同流量等级下的首次注视反应时间、注视时间与扫视时间,并进行岗前与岗后配对检验,以及同一指标组间的单因素方差分析,发现管制员决策能力和搜索能力受累计负荷影响较大,反应能力受流量因素影响较大。
-
关键词:
- 空中交通管制员 /
- 个体工作负荷 /
- 熵权-CRITIC组合法 /
- 配对样本T检验 /
- 单因素方差分析法
Abstract:To address the issue of individual variability in workload tolerance, this study establishes a quantitative model for assessing controller workload. A test was devised for the purpose of collecting data from 24 area controllers both before and after their workday. Based on the test data, variables were selected for analysis that were deemed to be sensitive in terms of describing the individual load. Three dimensions were included in the comprehensive evaluation index system: cognitive workload, physiological reaction load, and psychological perception load. A model for the individual load index of controllers was developed. The optimal weights of the individual load index were determined through the application of the entropy weight-CRITIC combination method. The individual workload index of each controller was subsequently calculated. It was determined that there are notable discrepancies in the individual workload of controllers. The cognitive workload index is a principal indicator of the magnitude of the individual workload index for controllers. The cognitive workload is a principal index for determining the magnitude of the controller’s individual workload index. Additionally, there is a positive correlation between cognitive workload and the controller’s capacity for information retrieval, decision-making, and reaction. To further investigate the factors influencing the growth of controllers’ cognitive workload, the reaction time, gaze time, and sweep time of controllers under five distinct traffic levels were quantified. Additionally, pre-post and post-post paired tests were conducted, and one-way analysis of variance was performed between groups with the same indicator. The results showed that while controllers’ reaction ability was more affected by flow parameters, their decision-making and searching abilities were more vulnerable to cumulative load.
-

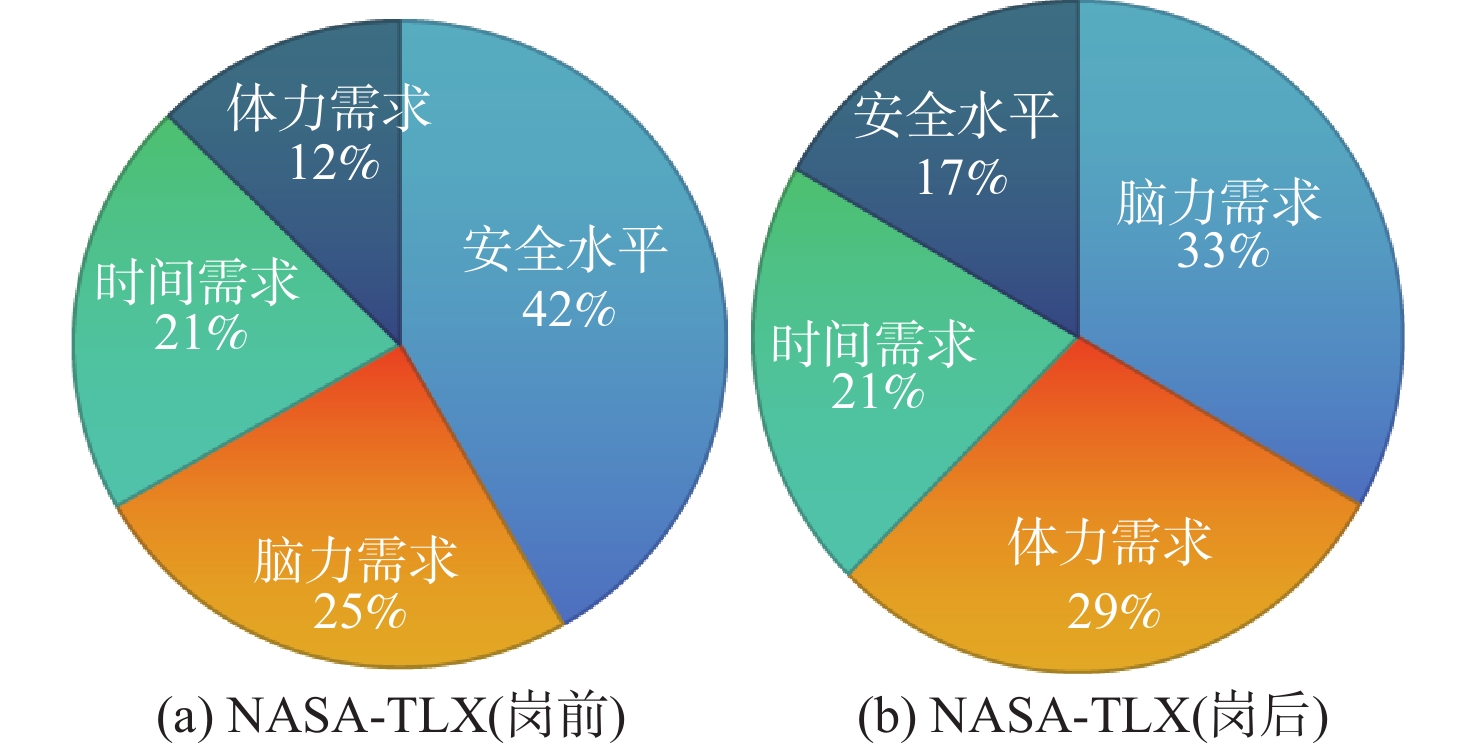
图 1 岗前与岗后NASA-TLX量表统计结果
Figure 1. Statistical results of pre-service and post-service NASA-TLX scales
表 1 各练习不同时段的流量水平要求
Table 1. Flow level requirements for different time periods for each exercise
实验时间/min 流量水平/架次 通行能力 流量等级 0~5 8~12 正常通行流量 1 6~11 13~17 大于正常通行流量40% 2 12~21 18~22 大于正常通行流量80% 3 22~30 23~26 大于正常通行流量120% 4 31~40 27~32 大于正常通行流量160% 5  下载: 导出CSV
表 2 PSS和NASA-TLX量表分数统计示例
Table 2. Examples of statistics of PSS and NASA-TLX scale scores
量表名称 测试时间 量表分数 01 02 03 ... 22 23 24 PSS 岗前 31 34 38 ... 37 32 31 岗后 33 42 46 ... 43 34 33 NASA-TLX 岗前 96 111 102 ... 85 71 79 岗后 87 117 100 ... 103 93 98
下载: 导出CSV
表 3 个体负荷指标岗前与岗后配对T检验结果
Table 3. Results of paired T-tests for pre-post and post-post individual load indicators
指标名称 平均值 标准偏差 标准误差平均值 差值 95% 置信区间 t 自由度 p 下限 上限 压力知觉量表 − 3.04167 4.35869 0.88971 − 4.88218 − 1.20115 −3.419 23 0.002 NASA-TLX量表 − 6.41667 12.87369 2.62783 − 11.85275 −0 .98058 −2.442 23 0.023 β波均值 2.12304 1.20662 0.24630 1.61353 2.63255 8.620 23 0 皮肤导电均值 2.26122 3.68517 0.75223 0.70511 3.81733 3.006 23 0.006 右眼瞳孔直径 −0 .12961 0.24076 0.04914 −0 .23128 −0 .02795 −2.637 23 0.015 反应时间均值 − 13.68562 23.12441 4.72025 − 23.45020 − 3.92103 −2.899 23 0.008 注视时间均值 − 52.74038 71.13103 14.51956 − 82.77638 − 22.70438 −3.632 23 0.001 扫视时间均值 − 2.67652 4.93769 1.00790 − 4.76153 −0 .59152 −2.656 23 0.014
下载: 导出CSV
表 4 熵权法、CRITIC权重法及组合权重法指标权重值
Table 4. Entropy weight method, CRITIC weight method and combination weight method indicator weight value
方法 $ \Delta P_{\text{SS}}' $ $ \Delta T_{\text{LX}}' $ $ \Delta {\beta }^{\prime} $ $ \Delta G_{\text{SR}}' $ $ \Delta P_{\text{D}}' $ $ \Delta F_{\text{FT}}' $ $ \Delta T_{\text{FT}}' $ $ \Delta S_{\text{D}}' $ 熵权法 0.0963 0.1040 0.1531 0.1425 0.1847 0.1077 0.0823 0.1293 CRITIC权重法 0.0356 0.0962 0.0092 0.0327 0.0019 0.1854 0.5991 0.0400 组合权重法 0.0525 0.0985 0.0489 0.0631 0.0523 0.1646 0.4576 0.0625
下载: 导出CSV
表 5 管制员个体负荷指数
Table 5. Individual load index for controllers
序号 个体综合负荷指数 心理负荷指数 生理负荷指数 认知负荷指数 心理负荷占比/% 生理负荷占比/% 认知负荷占比/% 01 0.2709 0.0447 0.0526 0.1736 16.50 19.42 64.08 02 0.4879 0.0952 0.0747 0.3180 19.51 15.31 65.18 03 0.3644 0.0787 0.0084 0.2773 21.61 2.30 76.09 04 0.5490 0.0898 0.0720 0.3871 16.37 13.11 70.52 05 0.6418 0.1280 0.0584 0.4554 19.95 9.10 70.95 06 0.5412 0.0353 0.1020 0.4039 6.52 18.85 74.63 07 0.3397 0.0525 0.0630 0.2242 15.44 18.55 66.01 08 0.3579 0.1264 0.0673 0.1642 35.32 18.79 45.89 09 0.6450 0.0386 0.0296 0.5768 5.98 4.59 89.43 10 0.4749 0.0751 0.0622 0.3376 15.81 13.11 71.08 11 0.6183 0.0952 0.0993 0.4238 15.39 16.07 68.54 12 0.5705 0.0517 0.0526 0.4662 9.06 9.22 81.72 13 0.4097 0.0726 0.0614 0.2757 17.73 14.98 67.29 14 0.4613 0.0279 0.0542 0.3791 6.05 11.76 82.19 15 0.3715 0.0714 0.0341 0.2659 19.23 9.18 71.59 16 0.3830 0.0776 0.0725 0.2330 20.25 18.92 60.83 17 0.6724 0.0931 0.0917 0.4875 13.85 13.65 72.51 18 0.4593 0.0509 0.0825 0.3260 11.07 17.96 70.97 19 0.5675 0.0780 0.0694 0.4201 13.75 12.23 74.02 20 0.3016 0.1038 0.1138 0.0839 34.43 37.73 27.83 21 0.6468 0.1042 0.1067 0.4359 16.11 16.50 67.39 22 0.5746 0.1132 0.0593 0.4021 19.71 10.32 69.97 23 0.6873 0.1083 0.0532 0.5257 15.76 7.75 76.49 24 0.6390 0.1022 0.0769 0.4599 15.99 12.03 71.97
下载: 导出CSV
表 6 首次注视反应时间岗前与岗后配对样本检验结果
Table 6. Results of pre-post and post-post paired sample tests of reaction time
流量等级 平均值 标准偏差 标准误差平均值 差值 95% 置信区间 t 自由度 p 下限 上限 1 − 8.04999 22.00440 4.58824 − 17.56540 1.46543 −1.754 22 0.093 2 − 5.29739 23.70005 4.94180 − 15.54606 4.95128 −1.072 22 0.295 3 − 14.77957 30.21767 6.30082 − 27.84667 − 1.71246 −2.346 22 0.028 4 − 17.40565 40.04535 8.35003 − 34.72256 −0 .08875 −2.085 22 0.049 5 − 27.16471 43.69113 9.11023 − 46.05817 − 8.27125 −2.982 22 0.007
下载: 导出CSV
表 7 持续注视时间岗前与岗后配对样本检验结果
Table 7. Results of paired sample tests for total gaze time pre-post and post-post
流量等级 平均值 标准偏差 标准误差平均值 差值 95% 置信区间 t 自由度 p 下限 上限 1 − 62.65295 77.78169 16.21860 − 96.28827 − 29.01762 −3.863 22 0.001 2 − 71.83003 95.71842 19.95867 − 113.22178 − 30.43828 −3.599 22 0.002 3 − 63.85232 93.74597 19.54739 − 104.39112 − 23.31353 −3.267 22 0.004 4 − 59.50849 81.25926 16.94373 − 94.64763 − 24.36935 −3.512 22 0.002 5 − 56.61133 77.23897 16.10544 − 90.01197 − 23.21070 −3.515 22 0.002
下载: 导出CSV
表 8 扫视时间岗前与岗后配对样本检验结果
Table 8. Results of paired samples test for pre-post and post-post scanning time
流量等级 平均值 标准偏差 标准误差平均值 差值 95% 置信区间 t 自由度 p 下限 上限 1 − 3.68455 7.48156 1.56001 − 6.91982 −0 .44928 −2.362 22 0.027 2 − 2.60707 5.53559 1.15425 − 5.00084 −0 .21331 −2.259 22 0.034 3 − 3.03494 5.70620 1.18983 − 5.50249 −0 .56740 −2.551 22 0.018 4 − 3.54109 6.66264 1.38926 − 6.42223 −0 .65995 −2.549 22 0.018 5 −0 .21424 6.73017 1.40334 − 3.12458 2.69610 −0.153 22 0.880
下载: 导出CSV
表 9 不同流量等级的岗前与岗后各组反应时间计算结果
Table 9. Calculated reaction times for pre-post and post-post groups with different flow levels
流量等级 管制员人数 岗前反应时间
(平均值±标准差)/s岗后反应时间
(平均值±标准差)/s1 23 24.2203 ±24.10469 32.2703 ±27.16593 2 23 38.0413 ±33.04562 43.3387 ±38.17695 3 23 47.8217 ±48.59611 62.6011 ±52.03680 4 23 60.0592 ±52.23413 75.9431 ±65.51692 5 23 78.5911 ±51.91243 105.7555 ±81.60227
下载: 导出CSV
表 10 岗前与岗后Welch平均值相等性稳健检验
Table 10. Robust test for equality of pre-post and post-post Welch means
指标名称 F分布 自由度 1 自由度 2 显著性 反应时间(岗前) 6.396 4 53.418 0 反应时间(岗后) 6.129 4 52.966 0
下载: 导出CSV
表 11 岗前首次注视反应时间Games-Howell方差分析检验结果
Table 11. Results of the Games-Howell analysis of variance test for pre-service reaction time
I流量 J流量 平均值
差值 (I-J)标准错误 显著性 95% 置信区间 下限 上限 1 2 − 13.82100 8.52885 0.493 − 38.1733 10.5313 3 − 23.60144 11.31105 0.250 − 56.2713 9.0684 4 − 35.83892 *11.99536 0.040 − 70.5657 − 1.1121 5 − 54.37084 *11.93449 0.001 − 88.9146 − 19.8271 2 1 13.82100 8.52885 0.493 − 10.5313 38.1733 3 − 9.78043 12.25383 0.930 − 44.8303 25.2694 4 − 22.01791 12.88818 0.441 − 58.9573 14.9215 5 − 40.54984 *12.83154 0.024 − 77.3202 − 3.7794 3 1 23.60144 11.31105 0.250 − 9.0684 56.2713 2 9.78043 12.25383 0.930 − 25.2694 44.8303 4 − 12.23748 14.87628 0.922 − 54.5564 30.0815 5 − 30.76940 14.82724 0.249 − 72.9473 11.4085 4 1 35.83892 *11.99536 0.040 1.1121 70.5657 2 22.01791 12.88818 0.441 − 14.9215 58.9573 3 12.23748 14.87628 0.922 − 30.0815 54.5564 5 − 18.53192 15.35565 0.747 − 62.2051 25.1412 5 1 54.37084 *11.93449 0.001 19.8271 88.9146 2 40.54984 *12.83154 0.024 3.7794 77.3202 3 30.76940 14.82724 0.249 − 11.4085 72.9473 4 18.53192 15.35565 0.747 − 25.1412 62.2051 注:“*”为标注2组之间的均值差异在统计学上显著的符号,表示p<0.05。
下载: 导出CSV
表 12 岗后首次注视反应时间Games-Howell方差分析检验结果
Table 12. Results of the Games-Howell analysis of variance test for post-service reaction time
I流量 J流量 平均值
差值 (I-J)标准错误 显著性 95% 置信区间 下限 上限 1 2 − 11.06841 9.77011 0.788 − 38.9814 16.8446 3 − 30.33080 12.24002 0.120 − 65.6252 4.9636 4 − 43.67279 *14.78903 0.045 − 86.6292 −0 .7164 5 − 73.48524 *17.93335 0.003 − 125.8875 − 21.0830 2 1 11.06841 9.77011 0.788 − 16.8446 38.9814 3 − 19.26239 13.45735 0.612 − 57.6818 19.1570 4 − 32.60438 15.81131 0.259 − 78.0359 12.8272 5 − 62.41684 *18.78530 0.018 − 116.7769 − 8.0568 3 1 30.33080 12.24002 0.120 − 4.9636 65.6252 2 19.26239 13.45735 0.612 − 19.1570 57.6818 4 − 13.34199 17.44594 0.939 − 63.0671 36.3831 5 − 43.15444 20.18045 0.226 − 100.9811 14.6722 4 1 43.67279 *14.78903 0.045 0.7164 86.6292 2 32.60438 15.81131 0.259 − 12.8272 78.0359 3 13.34199 17.44594 0.939 − 36.3831 63.0671 5 − 29.81245 21.82081 0.652 − 91.9951 32.3702 5 1 73.48524 *17.93335 0.003 21.0830 125.8875 2 62.41684 *18.78530 0.018 8.0568 116.7769 3 43.15444 20.18045 0.226 − 14.6722 100.9811 4 29.81245 21.82081 0.652 − 32.3702 91.9951 注:“*”为标注2组之间的均值差异在统计学上显著的符号,表示p<0.05。
下载: 导出CSV
-
[1] 中国民用航空局. 2023年民航行业发展统计公报[EB/OL]. (2024-03-30)[2024-05-23]. http://www.caac.gov.cn/XXGK/XXGK/TJSJ/202403/t20240320_223261.html.Civil Aviation Administration of China. 2023 Civil aviation industry development statistical bulletin[EB/OL]. (2024-03-30)[2024-05-23]. http://www.caac.gov.cn/XXGK/XXGK/TJSJ/202403/t20240320_223261.html(in Chinese). [2] 董斌, 胡明华, 丛玮, 等. 基于FCM的扇区交通运行特征分析[J]. 武汉理工大学学报(交通科学与工程版), 2015, 39(5): 939-943.Dong B, Hu M H, Cong W, et al. Research on characteristics of sector traffic based on FCM[J]. Journal of Wuhan University of Technology (Transportation Science & Engineering), 2015, 39(5): 939-943(in Chinese). [3] Pant R, Taukari A, Sharma K. Cognitive workload of air traffic controllers in area control center of mumbai enroute airspace[J]. Journal of Psychosocial Research, 2012, 7(2): 279-284. [4] 朱聃, 徐晨, 刘继新. 基于语音识别的管制员工作负荷评估[J]. 计算机应用研究, 2020, 37(S1): 24-26.Zhu D, Xu C, Liu J X. Evaluation of air traffic controller workload based on automatic speech recognition[J]. Application Research of Computers, 2020, 37(S1): 24-26(in Chinese). [5] 温瑞英, 王红勇. 基于岭回归-BP神经网络的管制工作负荷预测方法[J]. 交通运输系统工程与信息, 2015, 15(1): 123-129.Wen R Y, Wang H Y. A forecasting method of controller’s workload based on ridge regression-BP neural network[J]. Journal of Transportation Systems Engineering and Information Technology, 2015, 15(1): 123-129(in Chinese). [6] Frank N, Le P, Mills E, et al. Micromovements and discomfort associated with flight mission with helmet operation tasks with different levels of cognitive workload[J]. International Journal of Industrial Ergonomics, 2023, 95: 103441. [7] 王莉莉, 许凌鹏. 基于眼动数据的管制员注意力特征评价[J]. 中国安全科学学报, 2023, 33(2): 217-224.Wang L L, Xu L P. Evaluation of air traffic controller’s attention characteristics based on eye movement data[J]. China Safety Science Journal, 2023, 33(2): 217-224(in Chinese). [8] 王艳军, 胡明华, VU D. 空中交通管制员行为动力学[M]. 北京: 北京航空航天大学出版社, 2019: 45-58.Wang Y J, Hu M H, Vu D. Behavior dynamics of air traffic controllers[M]. Beijing: Beijing University of Aeronautics & Astronautics Press, 2019: 45-58(in Chinese). [9] Wang Y J, Wang L W, Lin S Y, et al. Effect of working experience on air traffic controller eye movement[J]. Engineering, 2021, 7(4): 488-494. [10] Ahlstrom U, Friedman-berg F J. Using eye movement activity as a correlate of cognitive workload[J]. International Journal of Industrial Ergonomics, 2006, 36(7): 623-636. [11] Wee H J, Lye S W, Pinheiro J P. Real time eye tracking interface for visual monitoring of radar controllers[C]//Proceedings of the AIAA Modeling and Simulation Technologies Conference. Reston: AIAA, 2017. [12] Dasari D, Crowe C, Ling C, et al. EEG pattern analysis for physiological indicators of mental fatigue in simulated air traffic control tasks[J]. Proceedings of the Human Factors and Ergonomics Society Annual Meeting, 2010, 54(3): 205-209. [13] Aricò P, Borghini G, Di Flumeri G, et al. Reliability over time of EEG-based mental workload evaluation during Air Traffic Management (ATM) tasks[C]//Proceedings of the 37th Annual International Conference of the IEEE Engineering in Medicine and Biology Society. Piscataway: IEEE Press, 2015: 7242-7245. [14] 陈彦峰. 睡意对脑电信号的影响[D]. 兰州: 兰州理工大学, 2013.Chen Y F. The effect of drowsiness on electroencephalogram (EEG)[D]. Lanzhou: Lanzhou University of Technology, 2013(in Chinese). [15] 陈凤兰. 基于多导生理信号的管制员疲劳分析方法研究[D]. 天津: 中国民航大学, 2018: 8-9.Chen F L. Research of analysis method for controller fatigue based on multi-channel physiological signals[D]. Tianjin: Civil Aviation University of China, 2018: 8-9(in Chinese). [16] 李金波, 许百华. 人机交互过程中认知负荷的综合测评方法[J]. 心理学报, 2009, 41(1): 35-43.Li J B, Xu B H. Synthetic assessment of cognitive load in human-machine interaction process[J]. Acta Psychologica Sinica, 2009, 41(1): 35-43(in Chinese). [17] Cohen S, Kamarck T, Mermelstein R. A global measure of perceived stress[J]. Journal of Health and Social Behavior, 1983, 24(4): 385. [18] Duncan C C, Barry R J, Connolly J F, et al. Event-related potentials in clinical research: guidelines for eliciting, recording, and quantifying mismatch negativity, P300, and N400[J]. Clinical Neurophysiology, 2009, 120(11): 1883-1908. [19] 钟铭恩, 吴平东, 彭军强, 等. 基于脑电信号的驾驶员情绪状态识别研究[J]. 中国安全科学学报, 2011, 21(9): 64-69.Zhong M E, Wu P D, Peng J Q, et al. Study on an emotional state recognition technology based on drivers’ EEGs[J]. China Safety Science Journal, 2011, 21(9): 64-69(in Chinese). [20] 傅根跃, 陈昌凯, 缪伟, 等. 测谎问题中的“情绪成分”对皮肤电反应的影响[J]. 中国临床心理学杂志, 2005, 13(3): 321-323.Fu G Y, Chen C K, Miao W, et al. The effect of emotionality in lie- detection questions on skin conductance response[J]. Chinese Journal of Clinical Psychology, 2005, 13(3): 321-323(in Chinese). [21] 中国民用航空局.雷达管制基础模拟机培训大纲 [EB/OL].(2012-06-26)[2024-02-01].www.caac.gov.cn.Civil Aviation Administration of China. Syllabus for basic radar control simulator training[EB/OL]. (2012-06-26)[2024-02-01].www.caac.gov.cn(in Chinese). [22] Shim J B, Joo S H, Shim H S. The direction and level of dominant eye according to the tests[J]. Journal of Korean Ophthalmic Optics Society, 2015, 20(3): 363-368. [23] 韩礼博, 门宝辉. 基于组合博弈论法的海河流域水资源承载力评价[J]. 水电能源科学, 2021, 39(11): 61-64.Han L B, Men B H. Evaluation of water resources carrying capacity in Haihe River Basin based on combinatorial game theory[J]. Water Resources and Power, 2021, 39(11): 61-64(in Chinese). -

 下载:
下载:


 点击查看大图
计量
- 文章访问数: 520
- HTML全文浏览量: 275
- PDF下载量: 24
- 被引次数: 0
