Characteristics of atmospheric density at 38°N in near space and its modeling technique
-
摘要:
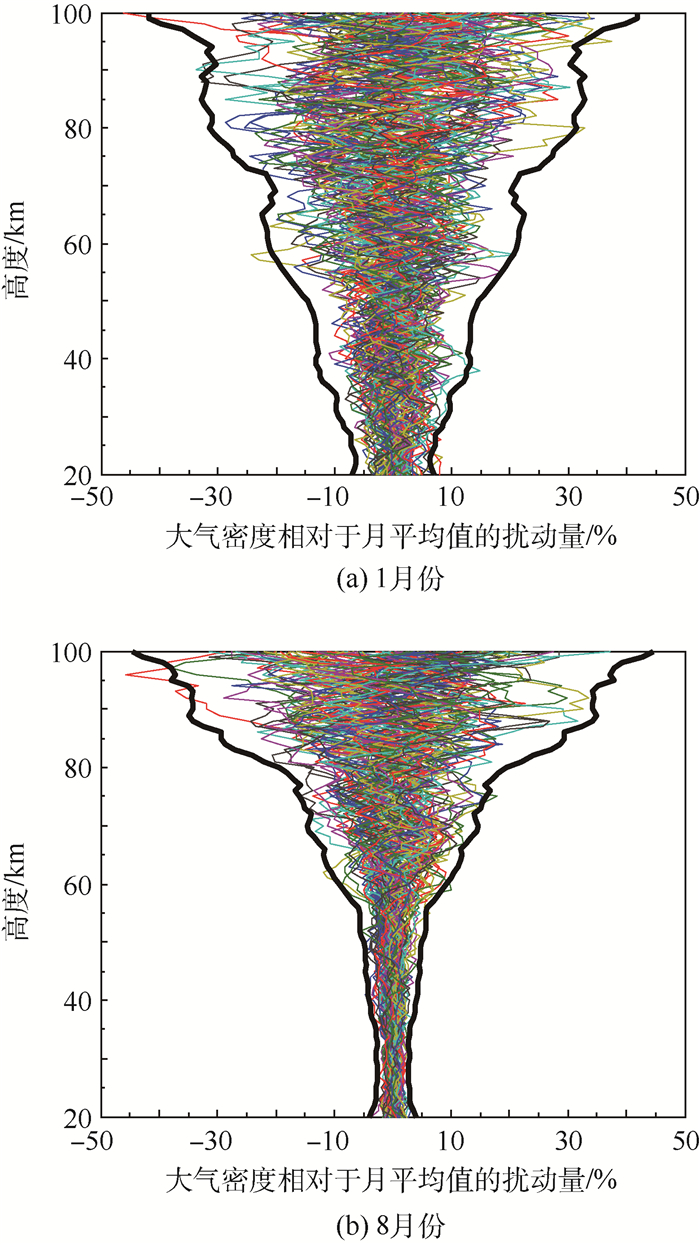
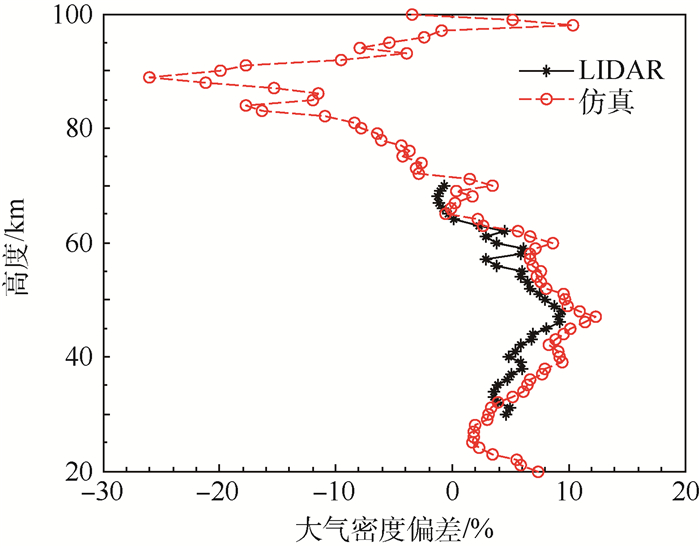
针对临近空间大气环境复杂时空变化的定量表征和仿真建模,基于11年TIMED/SABER大气密度数据,采用网格划分和数学统计的方法,得到了38°N大气密度在20~100 km的气候平均值和标准差。定量结果用于表征和分析了静态缓变气候平均态以及动态瞬变大气扰动态的变化规律,结果表明,38°N大气平均密度随高度、季节、经度变化显著。在此基础上,提出了临近空间大气密度表征为气候平均量和大气扰动量之和的建模方法,并建立了大气随机扰动自回归模型,通过仿真试验及与激光雷达大气密度实测数据的比较,结果表明该建模方法可行。
Abstract:The environment of near space atmosphere is very complex. Its spatial and temporal changes are hard to be characterized and modeled. With 11 years of TIMED/SABER atmospheric density data, the climate means and standard deviations at 38°N in 20-100 km were obtained by the method of global gridding and mathematical statistics. Quantitative results were used to represent and analyze the characteristics of static slow climate changes and dynamic transient atmospheric disturbances. The results show that the atmospheric density at 38°N varies remarkably with altitude, seasons and longitude. A modeling method was set up, where the atmospheric density in near space can be represented as the sum of the climate means and atmospheric disturbances. A self-regression model was established for the atmospheric random disturbances. Model simulations were taken and compared with the lidar-observed density data, showing that the modeling method is feasible.
-
Key words:
- near space /
- atmospheric density /
- aircraft /
- simulation /
- modeling
-
表 1 38°N、90°E大气密度在1月份的统计特征
Table 1. Statistical characteristics of atmospheric density at 38°N, 90°E in January
高度/km 平均密度/(kg·m-3) 密度标准差/(kg·m-3) 平均密度相对US76偏差/% 密度标准差相对US76百分比 20 0.085 25 0.001 968 -4.118 2.214 25 0.038 1 0.000 926 5 -4.934 2.312 30 0.017 31 0.000 539 3 -5.967 2.93 35 0.008 003 0.000 293 1 -5.448 3.463 40 0.003 826 0.000 168 8 -4.247 4.224 45 0.001 921 8.461×10⁻⁵ -2.294 4.304 50 0.001 008 4.928×10⁻⁵ -1.874 4.799 55 0.000 543 3 3.343×10⁻⁵ -4.343 5.886 60 0.000 284 5 2.015×10⁻⁵ -8.115 6.508 65 0.000 141 4 1.059×10⁻⁵ -13.37 6.487 70 6.53×10⁻⁵ 4.467×10⁻⁶ -21.16 5.393 75 2.935×10⁻⁵ 2.663×10⁻⁶ -26.49 6.672 80 1.329×10⁻⁵ 1.395×10⁻⁶ -28.02 7.557 85 5.984×10⁻⁶ 6.546×10⁻⁷ -27.19 7.965 90 2.707×10⁻⁶ 2.839×10⁻⁷ -20.63 8.325 95 1.249×10⁻⁶ 1.361×10⁻⁷ -10.23 9.788 100 5.39×10⁻⁷ 7.51×10⁻⁸ -3.652 13.43 表 2 38°N、90°E大气密度在8月份的统计特征
Table 2. Statistical characteristics of atmospheric density at 38°N, 90°E in August
高度/km 平均密度/(kg·m-3) 密度标准差/(kg·m-3) 平均密度相对US76偏差/% 密度标准差相对US76百分比 20 0.095 14 0.001 27 7.006 1.428 25 0.041 36 0.000 390 3 3.187 0.973 9 30 0.019 09 0.000 183 5 3.682 0.996 9 35 0.008 991 8.957×10⁻⁵ 6.23 1.058 40 0.004 309 5.803×10⁻⁵ 7.835 1.452 45 0.002 152 3.312×10⁻⁵ 9.461 1.685 50 0.001 126 1.897×10⁻⁵ 9.659 1.847 55 0.000 605 6 1.151×10⁻⁵ 6.626 2.026 60 0.000 323 4 9.916×10⁻⁶ 4.442 3.203 65 0.000 164 5 6.453×10⁻⁶ 0.768 8 3.954 70 8.006×10⁻⁵ 3.916×10⁻⁶ -3.329 4.728 75 3.724×10⁻⁵ 1.984×10⁻⁶ -6.714 4.971 80 1.626×10⁻⁵ 1.061×10⁻⁶ -11.93 5.746 85 6.64×10⁻⁶ 6.488×10⁻⁷ -19.22 7.894 90 2.71×10⁻⁶ 3.082×10⁻⁷ -20.52 9.038 95 1.156×10⁻⁶ 1.457×10⁻⁷ -16.92 10.48 100 4.922×10⁻⁷ 7.302×10⁻⁸ -12.01 13.05 表 3 38°N假定航迹8月份某次大气密度的仿真数据
Table 3. Simulation data of atmospheric density along supposed flight trace at 38°N in August
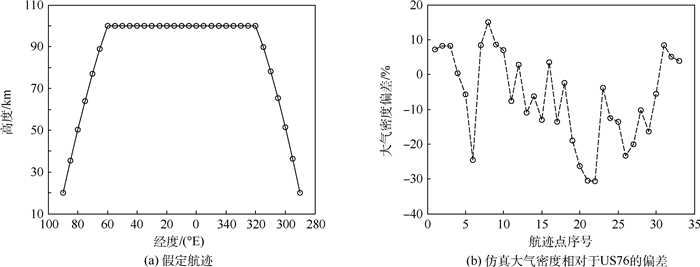
序号 经度/(°E) 高度/km 平均密度/(kg·m-3) 密度标准差/(kg·m-3) 仿真密度扰动量/(kg·m-3) 仿真密度总和/(kg·m-3) US76标准密度/(kg·m-3) 大气密度偏差/% 1 90 20 0.095 14 0.00127 0.000 194 6 0.095 33 0.088 91 7.225 2 85 35.56 0.008 304 8.674×10⁻⁵ 0.000 125 0.008 429 0.007 794 8.151 3 80 50.22 0.001 096 1.941×10⁻⁵ -1.411×10⁻⁵ 0.001 082 0.001 8.207 4 75 64 0.000 188 4 6.354×10⁻⁶ -1.692×10⁻⁶ 0.000 186 7 0.000 18 6 0.373 5 70 76.89 2.717×10⁻⁵ 1.615×10⁻⁶ 1.123×10⁻⁶ 2.829×10⁻⁵ 2.999×10⁻⁵ -5.661 6 65 88.89 3.344×10⁻⁶ 3.336×10⁻⁷ -2.023×10⁻⁷ 3.141×10⁻⁶ 4.162×10⁻⁶ -24.53 7 60 100 4.997×10⁻⁷ 7.820×10⁻⁸ 1.066×10⁻⁷ 6.064×10⁻⁷ 5.594×10⁻⁷ 8.397 8 55 100 5.058×10⁻⁷ 7.763×10⁻⁸ 1.373×10⁻⁷ 6.432×10⁻⁷ 5.594×10⁻⁷ 14.97 9 50 100 5.028×10⁻⁷ 7.943×10⁻⁸ 1.045×10⁻⁷ 6.073×10⁻⁷ 5.594×10⁻⁷ 8.557 10 45 100 4.943×10⁻⁷ 7.739×10⁻⁸ 1.044×10⁻⁷ 5.987×10⁻⁷ 5.594×10⁻⁷ 7.032 11 40 100 5.019×10⁻⁷ 8.076×10⁻⁸ 1.450×10⁻⁸ 5.164×10⁻⁷ 5.594×10⁻⁷ -7.684 12 35 100 5.012×10⁻⁷ 7.309×10⁻⁸ 7.436×10⁻⁸ 5.756×10⁻⁷ 5.594×10⁻⁷ 2.898 13 30 100 4.936×10⁻⁷ 8.246×10⁻⁸ 4.283×10⁻⁹ 4.979×10⁻⁷ 5.594×10⁻⁷ -11 14 25 100 4.927×10⁻⁷ 6.966×10⁻⁸ 3.191×10⁻⁸ 5.246×10⁻⁷ 5.594×10⁻⁷ -6.215 15 20 100 4.864×10⁻⁷ 7.377×10⁻⁸ 4.104×10⁻¹⁰ 4.868×10⁻⁷ 5.594×10⁻⁷ -12.98 16 15 100 4.889×10⁻⁷ 7.340×10⁻⁸ 9.052×10⁻⁸ 5.794×10⁻⁷ 5.594×10⁻⁷ 3.583 17 10 100 4.864×10⁻⁷ 6.865×10⁻⁸ -3.041×10⁻⁹ 4.834×10⁻⁷ 5.594×10⁻⁷ -13.59 18 5 100 4.910×10⁻⁷ 7.274×10⁻⁸ 5.459×10⁻⁸ 5.456×10⁻⁷ 5.594×10⁻⁷ -2.464 19 0 100 4.884×10⁻⁷ 7.715×10⁻⁸ -3.546×10⁻⁸ 4.529×10⁻⁷ 5.594×10⁻⁷ -19.03 20 355 100 4.874×10⁻⁷ 7.358×10⁻⁸ -7.477×10⁻⁸ 4.126×10⁻⁷ 5.594×10⁻⁷ -26.24 21 350 100 4.839×10⁻⁷ 8.645×10⁻⁸ -9.498×10⁻⁸ 3.889×10⁻⁷ 5.594×10⁻⁷ -30.48 22 345 100 4.853×10⁻⁷ 8.262×10⁻⁸ -9.750×10⁻⁸ 3.878×10⁻⁷ 5.594×10⁻⁷ -30.68 23 340 100 4.899×10 8.115×10⁻⁸ 4.824×10⁻⁸ 5.381×10⁻⁷ 5.594×10⁻⁷ -3.8 24 335 100 4.880×10⁻⁷ 8.184×10⁻⁸ 1.240×10⁻⁹ 4.892×10⁻⁷ 5.594×10⁻⁷ -12.54 25 330 100 5.026×10⁻⁷ 8.033×10⁻⁸ -1.913×10⁻⁸ 4.835×10⁻⁷ 5.594×10⁻⁷ -13.57 26 325 100 4.969×10⁻⁷ 7.662×10⁻⁸ -6.842×10⁻⁸ 4.285×10⁻⁷ 5.594×10⁻⁷ -23.4 27 320 100 4.883×10⁻⁷ 7.899×10⁻⁸ -4.075×10⁻⁸ 4.475×10⁻⁷ 5.594×10⁻⁷ -20 28 315 89.7 2.973×10⁻⁶ 3.369×10⁻⁷ 2.661×10⁻⁷ 3.239×10⁻⁶ 3.611×10⁻⁶ -10.31 29 310 78.18 2.239×10⁻⁵ 1.412×10⁻⁶ -1.841×10⁻⁶ 2.055×10⁻⁵ 2.458×10⁻⁵ -16.41 30 305 65.45 0.000 155 1 6.633×10⁻⁶ -9.634×10⁻⁶ 0.000 145 4 0.000 154 -5.547 31 300 51.52 0.000 929 1 1.755×10⁻⁵ -3.237×10⁻⁶ 0.000 925 8 0.000 854 7 8.327 32 295 36.36 0.007 313 7.660×10⁻⁵ -7.940×10⁻⁵ 0.007 233 0.006 886 5.037 33 290 20 0.092 51 0.001 049 -0.000 174 2 0.092 33 0.088 91 3.851 -
[1] TSIEN H S.Superaerodynamics, mechanics of rarefied gases[J].Journal of the Aeronautical Sciences, 1946, 13(12):653-664. doi: 10.2514/8.11476 [2] 姚伟, 李勇, 王文隽, 等.平流层飞艇热力学模型和上升过程仿真分析[J].宇航学报, 2007, 28(3):603-607. http://www.cnki.com.cn/Article/CJFDTOTAL-YHXB200703018.htmYAO W, LI Y, WANG W J, et al.Thermodynamic model and numerical simulation of a stratospheric airship take-off process[J].Journal of Astronautics, 2007, 28(3):603-607(in Chinese). http://www.cnki.com.cn/Article/CJFDTOTAL-YHXB200703018.htm [3] 刘强, 武哲, 祝明, 等.平流层气球热动力学仿真[J].北京航空航天大学学报, 2013, 39(12):1578-1583.LIU Q, WU Z, ZHU M, et al.Thermal-dynamic simulation of stratospheric balloon[J].Journal of Beijing University of Aeronautics and Astronautics, 2013, 39(12):1578-1583(in Chinese). [4] 张智超, 高振勋, 蒋崇文, 等.高超声速气动热数值计算壁面网格准则[J].北京航空航天大学学报, 2015, 41(4):594-600.ZHANG Z C, GAO Z X, JIANG C W, et al.Grid generation criterions in hypersonic aeroheating computations[J].Journal of Beijing University of Aeronautics and Astronautics, 2015, 41(4):594-600(in Chinese). [5] 黄飞, 张亮, 程晓丽, 等.连续流失效对近空间飞行器气动特性的影响[J].空气动力学学报, 2013, 31(5):623-628. doi: 10.7638/kqdlxxb-2012.0002HUANG F, ZHANG L, CHENG X L, et al. Effects of continuum breakdown on aerodynamics of near space vehicle[J].Acta Aerodynamica Sinica, 2013, 31(5):623-628(in Chinese). doi: 10.7638/kqdlxxb-2012.0002 [6] 邓帆, 焦子涵, 付秋军, 等.面向总体性能的高速飞行器布局优化研究[J].北京航空航天大学学报, 2016, 42(12):2587-2595.DENG F, JIAO Z H, FU Q J, et al.Research of hypersonic vehicle shape optimal design based on overall performance[J].Journal of Beijing University of Aeronautics and Astronautics, 2016, 42(12):2587-2595(in Chinese). [7] 凌超, 陈泽宇.中国上空过渡流区大气月平均状态的模拟结果[J].航天器环境工程, 2015, 32(3):236-242. http://www.cnki.com.cn/Article/CJFDTOTAL-HTHJ201503002.htmLING C, CHEN Z Y.Monthly averaged atmospheric conditions in the transition flow region of China based on the NRLMSISE-00 model[J].Spacecraft Environment Engineering, 2015, 32(3):236-242(in Chinese). http://www.cnki.com.cn/Article/CJFDTOTAL-HTHJ201503002.htm [8] 季蓉芬.地球扰动大气模型[J].航天返回与遥感, 1995, 16(1):66-81. http://www.cnki.com.cn/Article/CJFDTOTAL-HFYG199501010.htmJI R F.The disturbed atmospheric model of the earth[J]. Spacecraft Recovery and Remote Sensing, 1995, 16(1):66-81(in Chinese). http://www.cnki.com.cn/Article/CJFDTOTAL-HFYG199501010.htm [9] 陈昭. 北半球标准大气(-2~80公里): GJB 365. 1-87[S]. 北京: 国防科学技术工业委员会, 1987.CHEN Z.Standard atmosphere in northern hemisphere(-2-80 km):GJB 365.1-87[S].Beijing:Commission of Science Technology and Industry for National Defense, 1987(in Chinese). [10] 陈昭. 航空与航天用参考大气(0~80公里): GJB 366. 1-87[S]. 北京: 国防科学技术工业委员会, 1987.CHEN Z.Reference atmosphere for aerospace use (0-80 km):GJB 366.1-87[S].Beijing:Commission of Science Technology and Industry for National Defense, 1987(in Chinese). [11] REMSBERG E E, MARSHALL B T, GARCIA-COMAS M, et al.Assessment of the quality of the version 1.07 temperature-versus-pressure profiles of the middle atmosphere from TIMED/SABER[J].Journal of Geophysical Research:Atmospheres, 2008, 113(D17):D17101. doi: 10.1029/2008JD010013 [12] GARCIA-COMAS M, LOPEZ-PUERTAS M, MARSHALL B T, et al.Errors in sounding of the atmosphere using broadband emission radiometry (SABER) kinetic temperature caused by non-local-thermodynamic-equilibrium model parameters[J].Journal of Geophysical Research:Atmospheres, 2008, 113(D24):D24106. doi: 10.1029/2008JD010105 [13] CHEN Z Y, LU D R.Global structures of the DE3 tide[J].Chinese Science Bulletin, 2009, 54(6):1073-1079. doi: 10.1007/s11434-008-0585-x [14] XU J, SMITH A K, LIU H L, et al.Seasonal and quasi-biennial variations in the migrating diurnal tide observed by thermosphere, ionosphere, mesosphere, energetics and dynamics (TIMED)[J]. Journal of Geophysical Research:Atmospheres, 2009, 114(D13):D13107. doi: 10.1029/2008JD011298 [15] XIAO C Y, HU X, TIAN J H.Global temperature stationary planetary waves extending from 20 to 120 km observed by TIMED/SABER[J].Journal of Geophysical Research:Atmospheres, 2009, 114(D17):D17101. doi: 10.1029/2008JD011349 [16] 张云, 熊建刚, 万卫星.中层大气重力波的全球分布特征[J].地球物理学报, 2011, 54(4):427-435. http://www.cnki.com.cn/Article/CJFDTOTAL-DQWX201107004.htmZHANG Y, XIONG J G, WAN W X.Analysis on the global morphology of middle atmospheric gravity waves[J].Chinese Journal Geophysics, 2011, 54(4):427-435(in Chinese). http://www.cnki.com.cn/Article/CJFDTOTAL-DQWX201107004.htm [17] HUANG Y Y, ZHANG S D, YI F, et al.Global climatological variability of quasi-two-day waves revealed by TIMED/SABER observations[J].Annales Geophysicae, 2013, 31(6):1061-1075. doi: 10.5194/angeo-31-1061-2013 [18] PANCHEVA D, MUKHTAROV P, SMITH A K.Climatology of the migrating terdiurnal tide (TW3) in SABER/TIMED temperatures[J].Journal of Geophysical Research, 2013, 118(4):1755-1767. [19] 万田, 刘洪伟, 樊菁. 100 km附近大气密度模型的误差带和置信度[J].中国科学:物理学力学天文学, 2015, 45(12):124706. http://www.cnki.com.cn/Article/CJFDTOTAL-JGXK201512007.htmWAN T, LIU H W, FAN J.Error band and confidence coefficient of atmospheric density models around altitude 100 km[J]. Scientia Sinica-Physica, Mechanica & Astronomica, 2015, 45(12):124706(in Chinese). http://www.cnki.com.cn/Article/CJFDTOTAL-JGXK201512007.htm [20] 肖存英, 胡雄, 王博, 等.临近空间大气扰动变化特性的定量研究[J].地球物理学报, 2016, 59(4):1211-1221. doi: 10.6038/cjg20160404XIAO C Y, HU X, WANG B, et al.Quantitative studies on the variations of near space atmospheric fluctuation[J].Chinese Journal Geophysics, 2016, 59(4):1211-1221(in Chinese). doi: 10.6038/cjg20160404 [21] JUSTUS C G, WOODRUM A W, ROPER R G, et al.Four-D global reference atmosphere technical description.Part 1:NASA-TM-X-64871[R].Huntsville:George C.Marshall Space Flight Center, 1974:54-60. [22] YAN Z A, HU X, GUO W J, et al.Development of a mobile Doppler lidar system for wind and temperature measurements at 30-70 km[J].Journal of Quantitative Spectroscopy and Radiative Transfer, 2017, 188:52-59. doi: 10.1016/j.jqsrt.2016.04.024 [23] PREUSSE P, ECKERMANN S D, ERN M.Transparency of the atmosphere to short horizontal wavelength gravity waves[J].Journal of Geophysical Research:Atmospheres, 2008, 113(D24):D24104. doi: 10.1029/2007JD009682 期刊类型引用(0)
其他类型引用(9)
-


 下载:
下载:


