


-
摘要:
为满足空天试验研究中对参考大气模型的实际需求,即模型应具有跨时空的全球尺度覆盖性以及在起降关键航迹点的高精度性,提出了一种区域参考大气密度的建模与应用方法。首先对实测数据的冬夏季典型月份的大气密度特性,具体包括月均值与密度扰动进行统计分析,在此基础上提出了基于探空试验实测数据的全球参考大气模型(GRAM)的定量修正方法,从而构建起了包含有大气扰动与季节变化的区域参考大气密度模型。最后提出了区域参考大气密度模型向GRAM的过渡方法与实际应用方法。研究表明,探测地区的大气密度特性具有明显的冬夏季节性差异,需要根据季节构建相应的大气密度模型。区域参考大气模型的蒙特卡罗仿真可以有效模拟实测数据的大气密度特性。通过与GRAM过渡结合,参考大气模型既具有全球覆盖性,又具有很高的局部精度。
Abstract:To meet the requirement of reference atmospheric model in aerospace application, that is, the model should have global scale coverage across seasons and space, and high accuracy of key trajectory points, such as the range for takeoff and landing, a method for modeling and application of range reference atmospheric density is proposed. First, the characteristics of atmospheric density in typical months of winter and summer, including monthly mean and density perturbation, are analyzed. On this basis, a quantitative correction method of the global reference atmosphere model (GRAM) based on sounding measurement is proposed in this paper. Then, the range reference atmospheric density model with atmospheric perturbation and seasonal variation is constructed. Finally, the transition method and application method for the transition from the range reference atmospheric density model to GRAM are proposed. The simulation results show that the atmospheric density characteristics of the measured area have obvious seasonal differences in winter and summer, and the atmospheric density model should be built according to the season. The results of Monte Carlo simulation of the range reference atmospheric model show that it can effectively simulate the atmospheric density characteristics of the measured data. Combined with GRAM transition, the reference atmosphere model has both global coverage and high range accuracy.
-
Key words:
- sounding measurement /
- atmospheric density /
- aerospace application /
- modeling /
- simulation
-

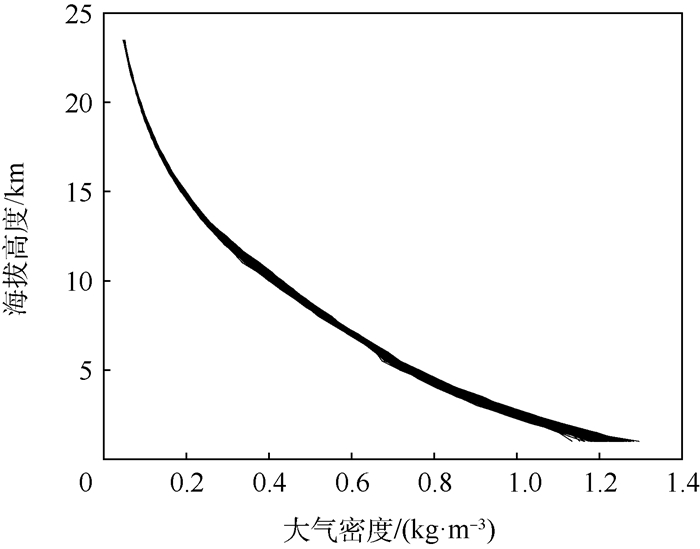
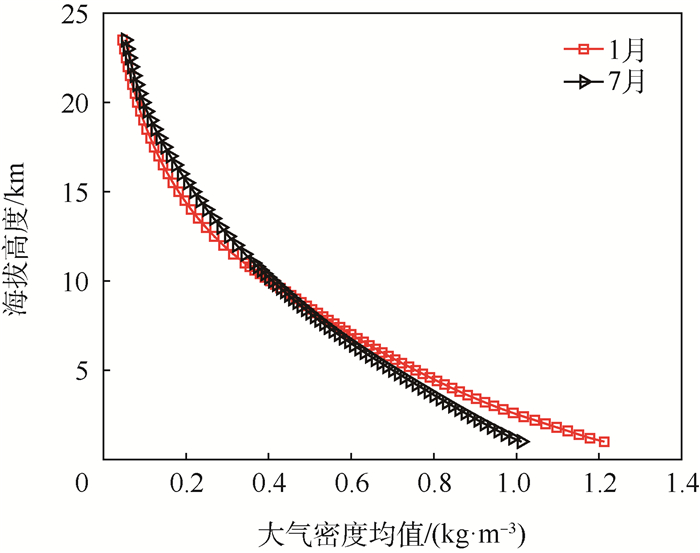
图 1 1月与7月大气密度均值随海拔高度变化
Figure 1. Variation of mean atmospheric density with altitude in January and July

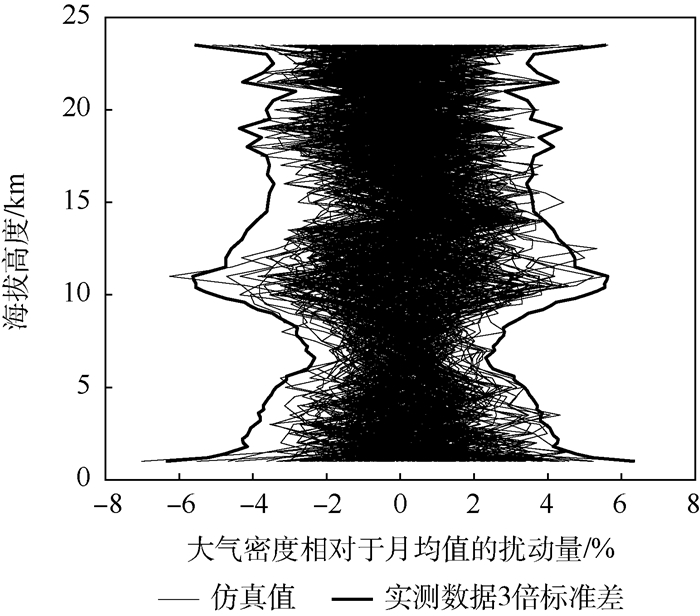
图 2 1月大气密度扰动量随海拔高度变化
Figure 2. Variation of atmospheric density perturbation with altitude in January

图 3 7月大气密度扰动量随海拔高度变化
Figure 3. Variation of atmospheric density perturbation with altitude in July

图 4 1月与7月大气密度相对月均值的扰动量的标准差随海拔高度变化
Figure 4. Variation of standard deviation of perturbation compared with mean atmospheric density of statistical month with altitude in January and July

图 5 实测数据与GRAM输出的1月大气密度均值对比
Figure 5. Contrast of mean atmospheric density of measured data to that of output of GRAM in January

图 6 实测数据与GRAM输出的7月大气密度均值对比
Figure 6. Contrast of mean atmospheric density of measured data to that of output of GRAM in July

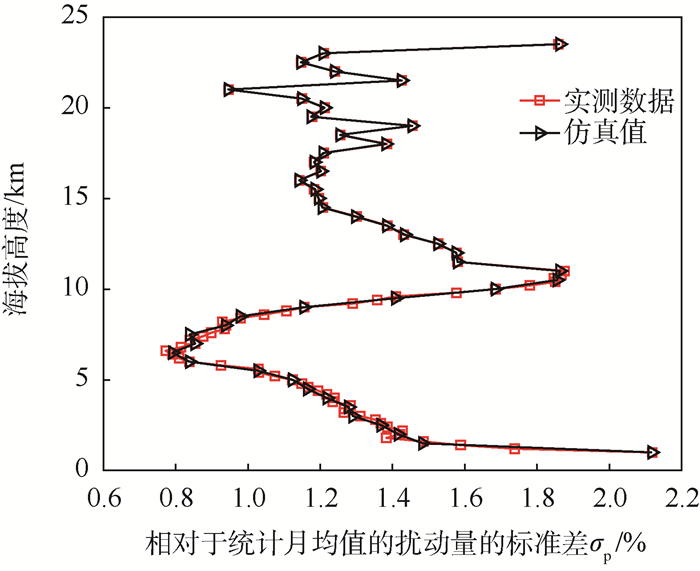
图 7 1月实测数据与GRAM输出的大气密度相对月均值的扰动量的标准差的对比
Figure 7. Contrast of standard deviation of measured data to that of output of GRAM in terms of perturbation compared with monthly mean atmospheric density in January

图 8 区域参考大气密度模型1月的蒙特卡罗仿真结果
Figure 8. Monte Carlo simulation results of range reference atmospheric density model in January

图 9 区域参考大气密度模型7月的蒙特卡罗仿真结果
Figure 9. Monte Carlo simulation results of range reference atmospheric density model in July

图 10 区域参考大气密度模型1月密度扰动量的蒙特卡罗仿真结果
Figure 10. Monte Carlo simulation results of density perturbation of range reference atmospheric density model in January

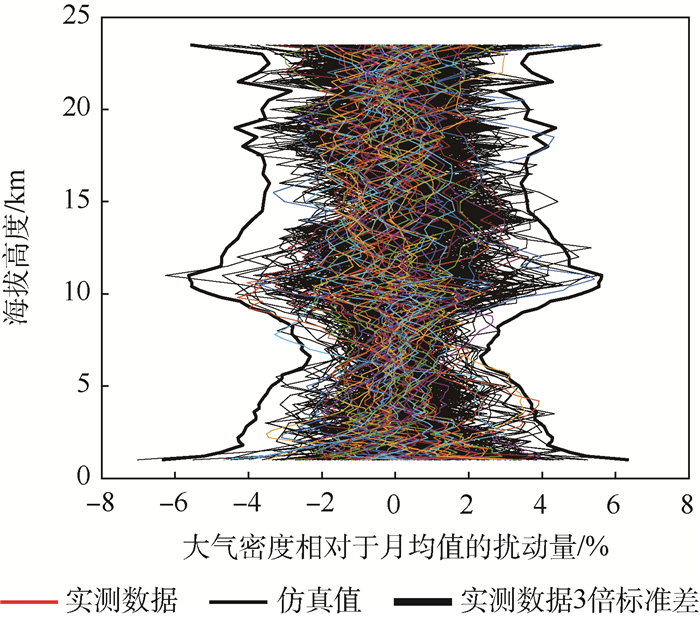
图 11 区域参考大气密度模型1月密度扰动量的蒙特卡罗仿真结果与实测数据对比
Figure 11. Contrast of Monte Carlo simulation results of density perturbation of range reference atmospheric density model to that of measured data in January

图 12 区域参考大气密度模型7月密度扰动量的蒙特卡罗仿真结果
Figure 12. Monte Carlo simulation results of density perturbation of range reference atmospheric density model in July

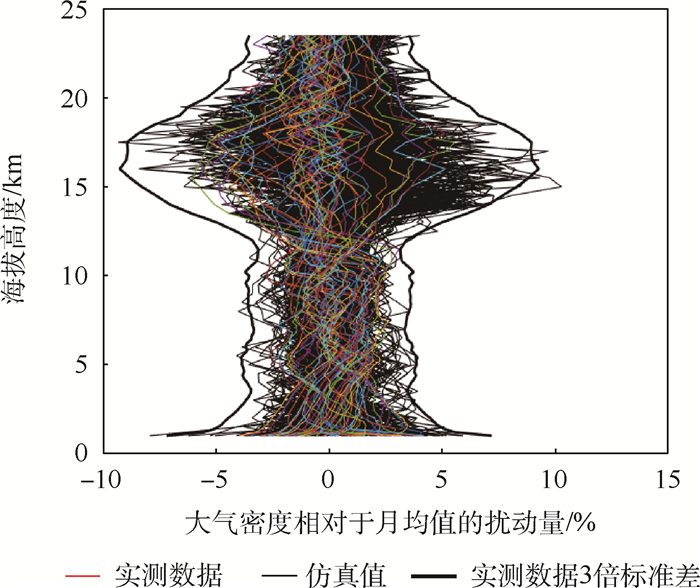
图 13 区域参考大气密度模型7月密度扰动量的蒙特卡罗仿真结果与实测数据对比
Figure 13. Contrast of Monte Carlo simulation results of density perturbation of range reference atmospheric density model to that of measured data in July

图 14 定量修正后1月实测数据与GRAM输出的大气密度相对月均值的扰动量的标准差的对比
Figure 14. Contrast of standard deviation of measured data to that of output of GRAM in terms of perturbation compared with monthly mean atmospheric density after quantitative correction in January

图 15 定量修正后7月实测数据与GRAM输出的大气密度相对月均值的扰动量的标准差的对比
Figure 15. Contrast of standard deviation of measured data to that of output of GRAM in terms of perturbation compared with monthly mean atmospheric density after quantitative correction in July

图 16 区域参考大气密度模型向GRAM的过渡方法示意
Figure 16. Illustration of transition method for range reference atmospheric density model to GRAM

图 17 与GRAM过渡结合的区域参考大气密度模型的应用方法示意
Figure 17. Illustration of application method for range reference atmospheric density model combined with GRAM transition
表 1 1月大气密度均值相对GRAM原输出的修正
Table 1. Correction of mean atmospheric density compared to GRAM primary output in January
海拔高度/km 均值相对原输出的修正量y/% 1 -0.60 2 0.22 3 0.91 4 1.57 5 2.26 6 0.10 7 -0.43 8 -1.03 9 -2.20 10 -3.37 11 -4.61 12 -5.20 13 -4.87 14 -4.85 15 -4.83 16 -4.91 17 -5.13 18 -5.28 19 -5.56 20 -5.57 21 -5.62 22 -5.57 23 -5.43 23.5 -5.57  下载: 导出CSV
表 2 7月大气密度均值相对GRAM原输出的修正
Table 2. Correction of mean atmospheric density compared to GRAM primary output in July
海拔高度/km 均值相对原输出的修正量y/% 1 6.69 2 7.84 3 7.05 4 7.66 5 5.69 6 6.67 7 6.00 8 5.21 9 4.06 10 1.81 11 -1.58 12 -5.07 13 -5.33 14 -6.35 15 -8.18 16 -9.02 17 -8.95 18 -7.97 19 -6.72 20 -5.16 21 -3.87 22 -6.59 23 -4.46 23.5 -3.43
下载: 导出CSV
表 3 1月大气密度相对月均值的扰动量的标准差相对GRAM原输出的修正
Table 3. Correction of standard deviation of atmospheric density perturbation compared to GRAM primary output in January
海拔高度/km 修正因子k 1 1.76 2 1.33 3 1.31 4 1.06 5 1.12 6 1.02 7 1.29 8 1.60 9 2.85 10 3.28 11 2.70 12 1.82 13 1.61 14 1.51 15 1.17 16 1.12 17 1.11 18 1.27 19 1.33 20 1.20 21 1.07 22 1.11 23 0.95 23.5 1.34
下载: 导出CSV
表 4 7月大气密度相对月均值的扰动量的标准差相对GRAM原输出的修正
Table 4. Correction of standard deviation of atmospheric density perturbation compared to GRAM primary output in July
海拔高度/km 修正因子k 1 1.99 2 1.40 3 1.25 4 1.05 5 1.28 6 1.50 7 1.68 8 2.01 9 2.40 10 2.31 11 1.53 12 1.32 13 1.87 14 2.73 15 2.72 16 3.03 17 2.79 18 2.59 19 2.02 20 1.79 21 1.42 22 1.28 23 1.24 23.5 1.17
下载: 导出CSV
-
[1] DALE J, BARRY R, WILLIAM V, et al.Atmospheric models for engineering applications: AIAA-2003-0894[R].Reston, VA: AIAA, 2003. [2] DALE J, WILLIAM V.How atmospheric thermodynamic parameters and model atmospheres have been used to help engineering in aerospace launch vehicle design & development[C]//50th AIAA Aerospace Sciences Meeting including the New Horizons Forum and Aerospace Exposition.Reston, VA: AIAA, 2012. [3] ALETA D, JUSTUS C G, VERNON K.Global reference atmospheric model (GRAM) series for aeroassist applications[C]//43rd AIAA Aerospace Sciences Meeting and Exhibit.Reston, VA: AIAA, 2005. [4] 陈昭.北半球标准大气(-2~80公里): GJB 365.1-87[S].北京: 国防工业技术科技委员会, 1987.CHEN Z.Standard atmosphere in northern hemisphere (-2-80 km): GJB 365.1-87[S].Beijing: Commission of Science Technology and Industry for National Defense, 1987(in Chinese). [5] 李群, 谢志辉, 阎书源, 等.中国参考大气(地面~80 km): GJB 5601-2006[S].北京: 中国人民解放军总装备部, 2006.LI Q, XIE Z H, YAN S Y, et al.China reference atmosphere(ground~80 km): GJB 5601-2006[S].Beijing: The PLA General Armament Department, 2006(in Chinese). [6] 姚志刚, 孙睿, 赵增亮, 等.风云三号卫星微波观测的临近空间大气扰动特征[J].地球物理学报, 2019, 62(2):473-488. http://d.old.wanfangdata.com.cn/Periodical/dqwlxb201902003YAO Z G, SUN R, ZHAO Z L, et al.Gravity waves in the near space observed by the microwave temperature sounder of the FY 3C meteorology satellite[J].Chinese Journal of Geophysics, 2019, 62(2):473-488(in Chinese). http://d.old.wanfangdata.com.cn/Periodical/dqwlxb201902003 [7] 肖存英, 胡雄, 王博, 等.临近空间大气扰动变化特性的定量研究[J].地球物理学报, 2016, 59(4):1211-1221. http://www.wanfangdata.com.cn/details/detail.do?_type=perio&id=dqwlxb201604004XIAO C Y, HU X, WANG B, et al.Quantitative studies on the variations of near space atmospheric fluctuation[J].Chinese Journal of Geophysics, 2016, 59(4):1211-1221(in Chinese). http://www.wanfangdata.com.cn/details/detail.do?_type=perio&id=dqwlxb201604004 [8] JUSTUS C G.Upper atmospheric mixing by gravity waves[C]//International Conference on the Environmental Impact of Aerospace Operations in the High Atmosphere.Reston, VA: AIAA, 1973: 1-4. [9] JUSTUS C G.Density perturbation simulation with the global reference atmospheric model[C]//26th Aerospace Sciences Meeting.Reston, VA: AIAA, 1988: 1-8. [10] 肖存英, 胡雄, 杨钧烽, 等.临近空间38°N大气密度特性及建模技术[J].北京航空航天大学学报, 2017, 43(9):1757-1765. https://bhxb.buaa.edu.cn/CN/abstract/abstract14184.shtmlXIAO C Y, HU X, YANG J F, et al.Characteristics of atmospheric density at 38°N in near space and its modeling technique[J].Journal of Beijing University of Aeronautics and Astronautics, 2017, 43(9):1757-1765(in Chinese). https://bhxb.buaa.edu.cn/CN/abstract/abstract14184.shtml [11] JUSTUS C G, JOHNSON D L.The GRAM model:Status of development and future aspects[J].Advances in Space Research, 1997, 19(4):549-558. doi: 10.1016/S0273-1177(97)00170-1 [12] JUSTUS C G, DUVALL A, JOHNSON D L.Earth global reference atmospheric model (GRAM-99) and trace constituents[J].Advances in Space Research, 2004, 34(8):1731-1735. doi: 10.1016/j.asr.2003.04.057 [13] LESLIE F.Earth global reference atmospheric model 2007(Earth-GRAM07)[C]//37th COSPAR Scientific Assembly.Washington, D.C.: NASA, 2008. [14] LESLIE F W, JUSTUS C G.The NASA marshall space flight center earth global reference atmospheric model-2010 Version: NASA/TM-2011-216467[R].Washington, D.C.: NASA Marshall Space Flight Center, 2019. [15] 杨钧烽, 肖存英, 胡雄, 等.临近空间风切变特性及其对飞行器的影响[J].北京航空航天大学学报, 2019, 45(1):57-65. doi: 10.3969/j.issn.1005-4561.2019.01.019YANG J F, XIAO C Y, HU X, et al.Wind shear characteristics in near space and their impacts on air vehicle[J].Journal of Beijing University of Aeronautics and Astronautics, 2019, 45(1):57-65(in Chinese). doi: 10.3969/j.issn.1005-4561.2019.01.019 [16] 高振荣, 田庆明, 刘晓云, 等.近58年河西走廊地区气温变化及突变分析[J].干旱区研究, 2010, 27(2):194-203. http://d.old.wanfangdata.com.cn/Periodical/ghqyj201002007GAO Z R, TIAN Q M, LIU X Y, et al.Analysis of temperature change and abrupt change in Hexi Corridor in recent 58 years[J].Research in the Arid Areas, 2010, 27(2):194-203(in Chinese). http://d.old.wanfangdata.com.cn/Periodical/ghqyj201002007 [17] 刘晓云, 岳平, 徐殿祥.酒泉市最近54a气温和降水特征分析[J].干旱区研究, 2006, 23(3):495-499. http://d.old.wanfangdata.com.cn/Periodical/ghqyj200603021LIU X Y, YUE P, XU D X.Analysis of temperature and precipitation characteristics in Jiuquan City in recent 54 years[J].Research in the Arid Areas, 2006, 23(3):495-499(in Chinese). http://d.old.wanfangdata.com.cn/Periodical/ghqyj200603021 -

 下载:
下载:


 点击查看大图
计量
- 文章访问数: 1004
- HTML全文浏览量: 104
- PDF下载量: 482
- 被引次数: 0
