Selection of measurement variables for hyperspectra of total phenol content in grape seeds based on Monte Carlo frequency method
-
摘要:
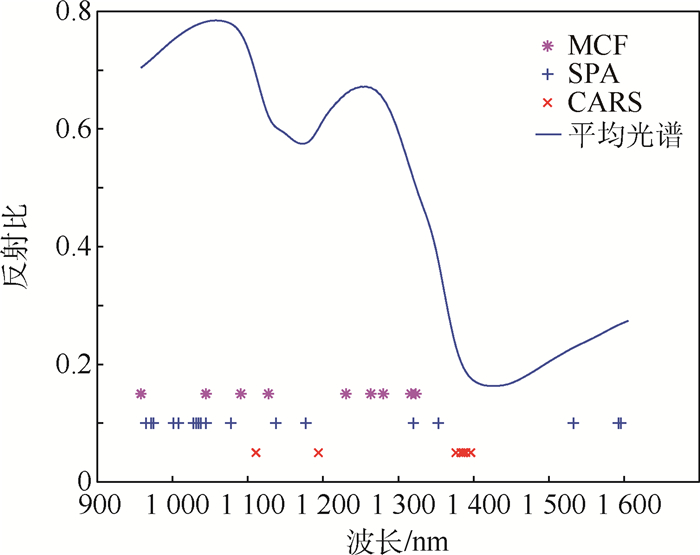
在利用高光谱建立葡萄籽总酚含量的预测模型中,为解决变量过多、模型复杂度高等问题,需依据光谱特点进行有效地数据降维。提出了一种蒙特卡罗频率法(MCF)对高光谱数据进行波长选择,并建立了葡萄籽总酚的支持向量回归(SVR)预测模型。该方法首先采用蒙特卡罗采样(MCS)选择波长子集;然后建立大量SVR子模型,并选出均方根误差(RMSE)较小的子模型,统计每个波长出现的频次;最后根据指数递减函数确定波长个数,选取频次最高的波长子集作为特征波长。结果表明,采用MCF可以在降维的同时提高模型的预测性能,波长数目由原始的196个减少到9个,波长范围均在950~1 400 nm,RMSE值从0.42减少到0.37,预测精度优于SPA等其他波长选择方法。因此,提出的基于MCF在高光谱数据处理中能有效选择特征波长,为准确建立预测模型提供了一种有效的方法。
-
关键词:
- 变量选择 /
- 蒙特卡罗采样(MCS) /
- 近红外高光谱 /
- 葡萄籽 /
- 总酚含量
Abstract:In order to solve the problems of too many variables and high model complexity, it is necessary to effectively reduce the dimension of the data according to the characteristics in establishing the prediction model of total phenol content in grape seeds by using hyperspectral data. In this paper, a Monte Carlo frequency (MCF) method was proposed to select the wavelength of hyperspectral data, and the support vector regression (SVR) prediction model of grape seed total phenols was established. The method uses Monte Carlo sampling to select wavelength subset, then establishes a large number of SVR sub-models, and selects sub-models with smaller root mean square error (RMSE) to count the frequency of each wavelength. Finally, the number of wavelengths is determined by exponential decline function, and the wavelength subset with the highest frequency is selected as the characteristic wavelength. The results show that the prediction performance of the model can be improved by using MCF method at the same time of dimensionality reduction. The number of wavelengths can be reduced from 196 to 9, the range of wavelengths is between 950 and 1400 nm, and the RMSE value can be reduced from 0.42 to 0.37. The prediction accuracy is better than other wavelength selection methods such as SPA. The results show that the proposed MCF method can effectively select characteristic wavelengths in hyperspectral data processing, which provides an effective method for the accurate establishment of prediction model.
-
表 1 葡萄籽总酚含量分布统计
Table 1. Distribution statistics of total phenol content in grape seeds
参数 训练集 预测集 样本数 48 12 最小值/(g·L-1) 1.720 8 2.192 7 最大值/(g·L-1) 8.386 9 8.326 3 平均值/(g·L-1) 4.531 9 4.972 3 标准偏差/(g·L-1) 1.642 9 1.858 6 表 2 不同降维方法的总酚预测结果比较
Table 2. Comparison of total phenol prediction results with different dimensionality reduction methods
方法 变量数 (c,g) 训练集 预测集 R2 RMSE R2 RMSE SVR 196 (256, 84.45) 0.952 4 0.133 8 0.900 4 0.416 3 MCF-SVR 9 (362, 2 048) 0.924 4 0.204 9 0.905 9 0.374 1 SPA-SVR 18 (2 896, 362) 0.920 8 0.216 0 0.886 7 0.476 7 CARS-SVR 7 (256, 1 448) 0.812 9 0.504 7 0.791 3 0.829 4 表 3 MCF结合不同回归方法的总酚预测结果比较
Table 3. Comparison of total phenol prediction results of MCF combined with different regression methods
回归方法 (c, g) 训练集 预测集 R2 RMSE R2 RMSE SVR (362, 2 048) 0.924 4 0.204 9 0.905 9 0.374 1 PLSR (20.55, 5 793) 0.884 7 0.366 2 0.853 9 0.546 6 RBF (862, 724) 0.872 2 0.340 6 0.875 6 0.428 9 -
[1] 张保华, 李江波, 樊书祥, 等.高光谱成像技术在果蔬品质与安全无损检测中的原理及应用[J].光谱学与光谱分析, 2014, 34(10):2743-2751. doi: 10.3964/j.issn.1000-0593(2014)10-2743-09ZHANG B H, LI J B, FAN S X, et al.Principle and application of high spectral imaging technology in nondestructive testing of fruit and vegetable quality and safety[J].Spectroscopy and Spectral Analysis, 2014, 34(10):2743-2751(in Chinese). doi: 10.3964/j.issn.1000-0593(2014)10-2743-09 [2] CHEN S, ZHANG F, NING J, et al.Predicting the anthocyanin content of wine grapes by NIR hyperspectral imaging[J].Food Chemistry, 2015, 172:788-793. doi: 10.1016/j.foodchem.2014.09.119 [3] EIMASRY G, SU D W, ALLEN P, et al.Near-infrared hyperspectral imaging for predicting colour, pH and tenderness of fresh beef[J].Journal of Food Engineering, 2012, 110(1):127-140. doi: 10.1016/j.jfoodeng.2011.11.028 [4] LEO L, ROGER J M, HERRERO-LANGREO A, et al.Comparison of multispectral indexes extracted from hyperspectral images for the assessment of fruit ripening[J].Journal of Food Engineering, 2011, 104(4):612-620. doi: 10.1016/j.jfoodeng.2011.01.028 [5] GMES V M, FERNANDES A M, FAIA A, et al.Comparison of different approaches for the prediction of sugar content in new vintages of whole port wine grape berries using hyperspectral imaging[J].Computers and Electronics in Agriculture, 2017, 140:244-254. doi: 10.1016/j.compag.2017.06.009 [6] LI W, PRASAD S, FOWLER J E, et al.Locality-preserving dimensionality reduction and classification for hyperspectral image analysis[J].IEEE Transactions on Geoscience & Remote Sensing, 2012, 50(4):1185-1198. [7] 宦克为, 刘小溪, 郑峰, 等.基于蒙特卡罗特征投影法的小麦蛋白质近红外光谱测量变量选择[J].农业工程学报, 2013, 29(4):266-271.HUAN K W, LIU X X, ZHENG F, et al.Selection of variables for wheat protein near infrared spectroscopy based on monte carlo characteristic projection[J].Journal of Agricultural Engineering, 2013, 29(4):266-271(in Chinese). [8] 郝勇, 孙旭东, 潘圆媛, 等.蒙特卡罗无信息变量消除方法用于近红外光谱预测果品硬度和表面色泽的研究[J].光谱学与光谱分析, 2011, 31(5):1225-1229. doi: 10.3964/j.issn.1000-0593(2011)05-1225-05HAO Y, SUN X D, PAN Y Y, et al.Monte-carlo method of elimination of uninformed variables was used to predict fruit hardness and surface color by near infrared spectroscopy[J].Spectroscopy and Spectral Analysis, 2011, 31(5):1225-1229(in Chinese). doi: 10.3964/j.issn.1000-0593(2011)05-1225-05 [9] 顾章源, 刘翔, 苏枫, 等.基于流形学习的多光谱优化波段选择算法研究[J].上海航天, 2017, 34(3):40-46.GU Z Y, LIU X, SU F, et al.Research on multi-spectral optimal band selection algorithm based on manifold learning[J].Aerospace Shanghai, 2017, 34(3):40-46(in Chinese). [10] ARAUJO M C U, SALDANHA T C B, GALVAO R K H, et al.The successive projections algorithm for variable selection in spectroscopic multicomponent analysis[J].Chemometrics & Intelligent Laboratory Systems, 2001, 57(2):65-73. [11] CENTNER V, MASSART D L, NOORD O E D, et al.Elimination of uninformative variables for multivariate calibration[J].Analytical Chemistry, 1996, 68(21):3851-3858. doi: 10.1021/ac960321m [12] MOROS J, KULIGOWSKI J, QINTAS G, et al.New cut-off criterion for uninformative variable elimination in multivariate calibration of near-infrared spectra for the determination of heroin in illicit street drugs[J].Analytica Chimica Acta, 2008, 630(2):150-160. doi: 10.1016/j.aca.2008.10.024 [13] LI H, LIANG Y, XU Q, et al.Key wavelengths screening using competitive adaptive reweighted sampling method for multivariate calibration[J].Analytica Chimica Acta, 2009, 648(1):77-84. doi: 10.1016/j.aca.2009.06.046 [14] CAI W, LI Y, SHAO X.A variable selection method based on uninformative variable elimination for multivariate calibration of near-infrared spectra[J].Chemometrics & Intelligent Laboratory Systems, 2008, 90(2):188-194. [15] LI H, LIANG Y, XU Q, et al.Model population analysis for variable selection[J].Journal of Chemometrics, 2010, 24(7-8):418-423. doi: 10.1002/cem.1300 [16] LI H, XU Q, ZHANG W, et al.Variable complementary network:A novel approach for identifying biomarkers and their mutual associations[J].Metabolomics, 2012, 8(6):1218-1226. doi: 10.1007/s11306-012-0410-z [17] HARBERTSON J F, PICCIOTTO E A, ACKERMANN K.Phenolic and anthocyanin assay for use with spectrophotometer[D].Davis, CA: University of California, 2005. [18] 褚小立, 袁洪福, 陆婉珍.近红外分析中光谱预处理及波长选择方法进展与应用[J].化学进展, 2004, 16(4):528-542. doi: 10.3321/j.issn:1005-281X.2004.04.008CHU X L, YUAN H F, LU W Z.Progress and application of spectral pretreatment and wavelength selection methods in nir analysis[J].Progress in Chemistry, 2004, 16(4):528-542(in Chinese). doi: 10.3321/j.issn:1005-281X.2004.04.008 [19] GORRY P A.General least-squares smoothing and differentiation by the convolution (Savitzky-Golay) method[J].Analytical Chemistry, 1990, 62(6):570-573. [20] ZHANG C, GUO C, LIU F, et al.Hyperspectral imaging analysis for ripeness evaluation of strawberry with support vector machine[J].Journal of Food Engineering, 2016, 179:11-18. doi: 10.1016/j.jfoodeng.2016.01.002 [21] NI Z, XU L, XIAODUO J, et al.Determination of total iron-reactive phenolics, anthocyanins and tannins in wine grapes of skins and seeds based on near-infrared hyperspectral imaging[J].Food Chemistry, 2017, 237:811-817. doi: 10.1016/j.foodchem.2017.06.007 [22] CHANG C C, LIN C J.LIBSVM:A library for support vector machines[J].ACM Transactions on Intelligent Systems and Technology, 2011, 2(3):27 期刊类型引用(1)
1. 任顺,张雄,任东,杨信廷,张力. 基于X射线荧光光谱与多特征串联策略的土壤重金属含量预测. 分析测试学报. 2020(07): 829-837 .  百度学术
百度学术其他类型引用(0)
-


 下载:
下载:


 百度学术
百度学术

