


Regional classification of CO2 emission reduction potential of China’s civil aircraft
-
摘要:
对中国进行科学的区域划分,是研究具有区域差异性与空间相关性航空器CO2排放问题并提出差异化CO2减排措施的重要基础。基于2007—2016年中国部分地区民用航空器运行数据,在构建CO2减排潜力分类模型的基础上,通过Kruskal算法得到省域网络关系最小生成树;采用谱聚类算法,以“最大化区划优度”为目标,划分航空器CO2减排潜力的不同区域。结果表明:最优区域划分为四分区,区划优度为0.35;航空器CO2减排潜力高的区域主要分布于中国西南和中南地区,潜力低的区域主要分布于东北和华北地区;针对各区域CO2减排特征,从民航局、机场和航空公司等不同主体提出了差异化的区域CO2减排措施。
Abstract:Scientific regional classification is fundamental for investigating aircraft CO2 emissions with regional differences and spatial relativity, and for proposing differentiated CO2 emission reduction measures. Using aircraft operation data from China’s some provinces over a ten-year time span (2007–2016), this paper first establishes a model of CO2 emission reduction potential. Then we employ the Kruskal algorithm to obtain the minimum spanning tree of the provincial network relationship. Next the spectral clustering algorithm is used to divide the area of CO2 emission reduction potential with the goal of maximizing the regional classification superiority. Our analysis shows that the optimal classification involves four regions with the regional classification superiority of 0.35. The region with the highest CO2 emission reduction potential is mainly in southwest and central south China, and the region with the lowest potential is mainly in northeast and north China. According to the regional characteristics, differentiated CO2 emission reduction measures are proposed for different subjects such as civil aviation administration, airports, and airlines.
-
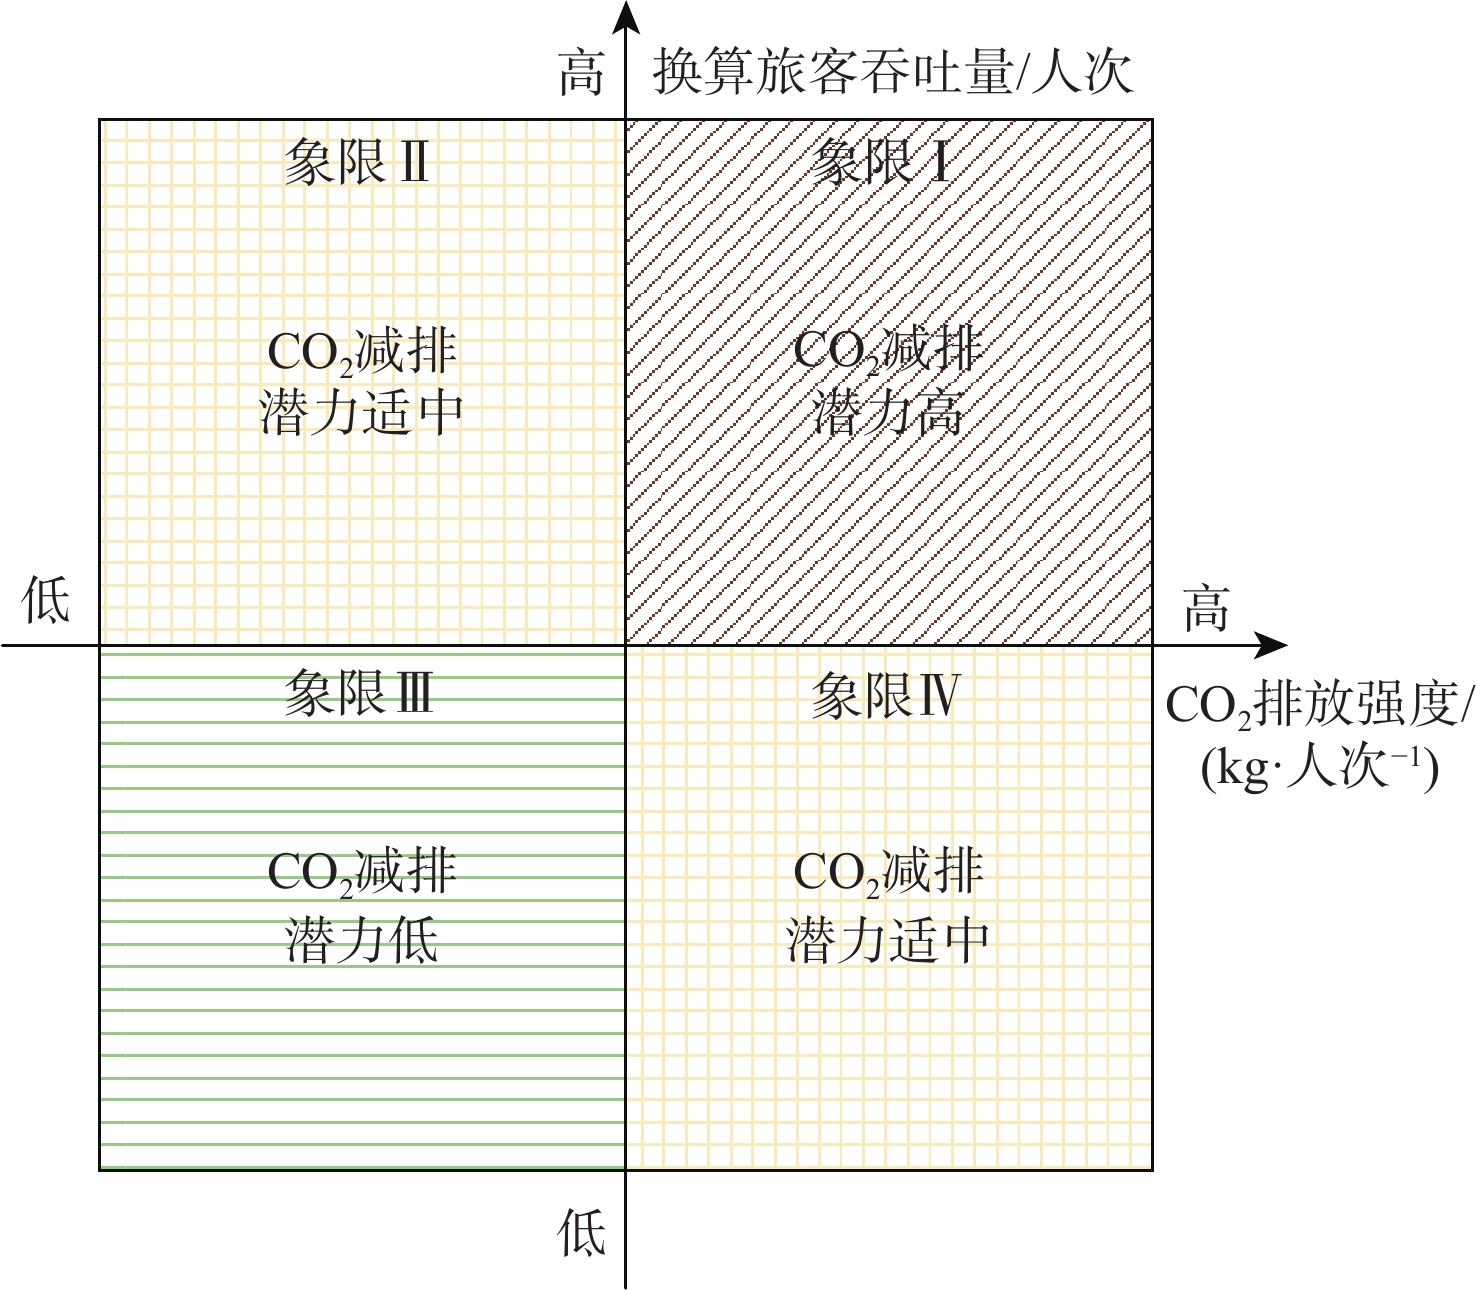
图 1 区域航空器CO2减排潜力分类模型
Figure 1. Classification model of CO2 emission reduction potential of regional aircraft

图 2 航空器CO2减排潜力省域邻接关系网络
Figure 2. Provincial adjacency network of aircraft CO2 emission reduction potential of aircraft

图 3 航空器CO2减排潜力连续最小生成树
Figure 3. Continuous MST of aircraft CO2 emission reduction potential of aircraft
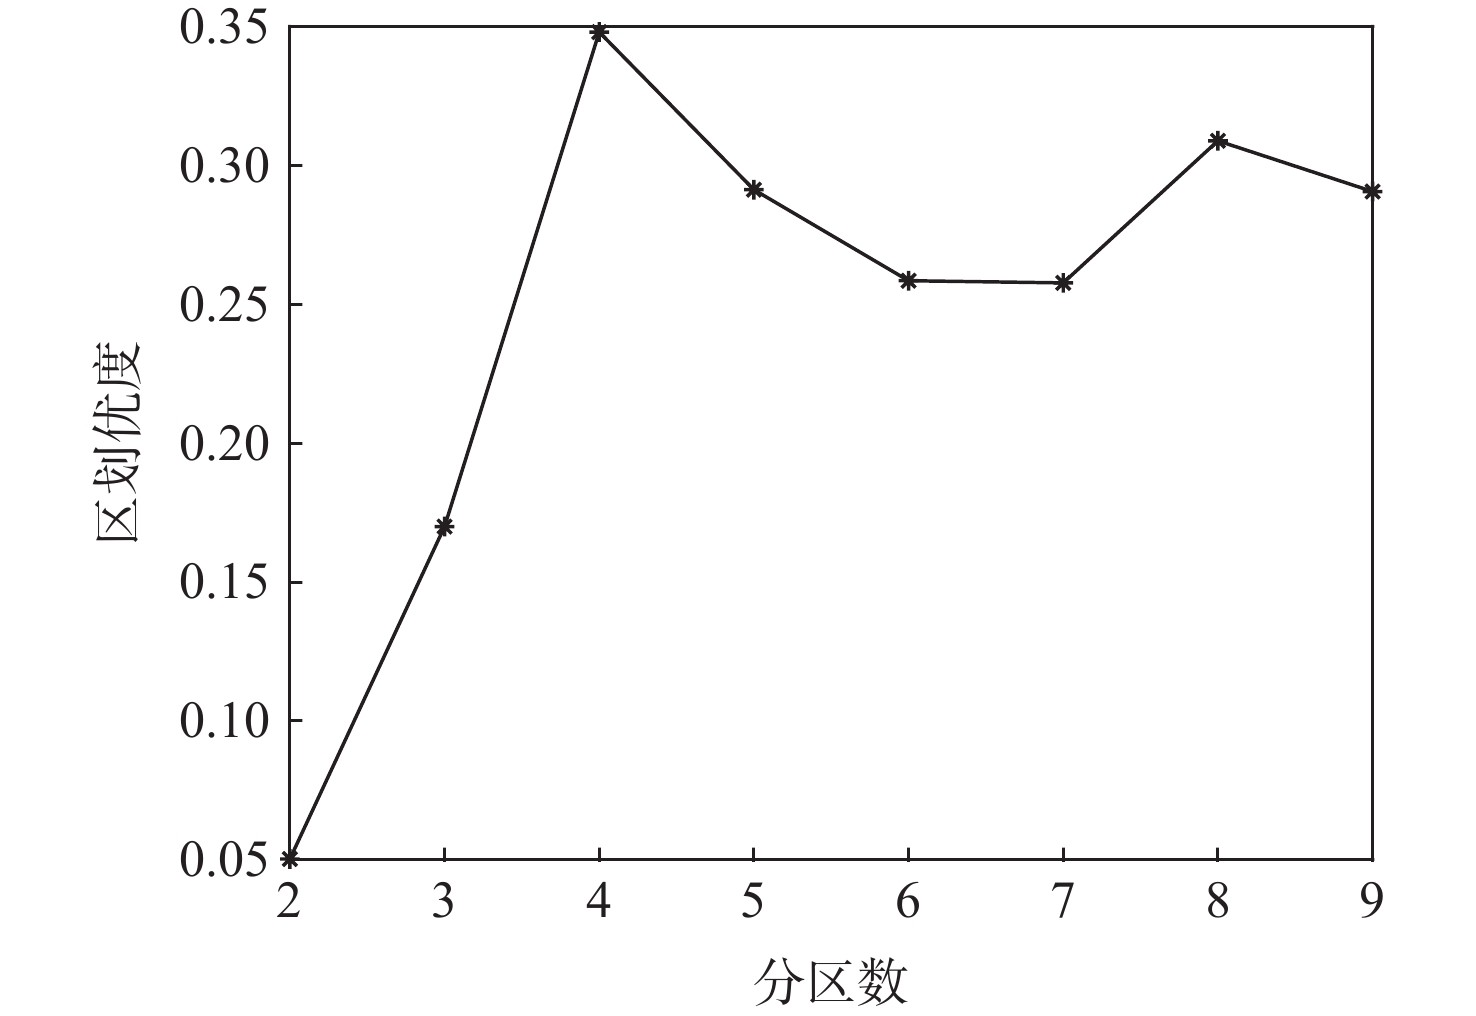
图 4 不同分区数下的区划优度
Figure 4. Regional classification superiority with different partition numbers

图 5 航空器CO2减排潜力最小生成树截断示意图
Figure 5. The truncated MST digram of aircraft CO2 emission reduction potential of aircraft

图 6 四分区下区域航空器CO2减排潜力
Figure 6. CO2 emission reduction potential of regional aircraft under four partions
表 1 航空器CO2减排潜力相关指标统计量
Table 1. Index statistics of Aircraft CO2 emission reduction potential
指标 CO2排放
量/
108 kgCO2排放
强
度/(kg·人次−1)货邮
吞吐
量/
107 kg旅客
吞吐
量/106人次换算旅客
吞
吐量/106人次最大值 33.20 73.17 386.92 114.40 149.45 最小值 0.23 10.91 0.53 0.82 0.93 均值 5.50 25.43 37.77 21.48 25.68 方差 27.81 101.46 5185.26 508.76 889.26  下载: 导出CSV
表 2 不同区域划分方法的区划优度
Table 2. Regional classification superiority with different partition methods
分区方法 区划优度 四分区(本文方法) 0.35 东中西分区 0.16 六大行政分区 0.07 八大经济分区 0.25
下载: 导出CSV
-
[1] JACOB T, JACOPO T, APOSTOLOS P, et al. CO2 emissions from fuel combustion: IEA 2020[R]. Paris: OECD Publishing, 2020: 9-12. [2] WU C T, HE X H, DOU Y. Regional disparity and driving forces of CO2 emissions: Evidence from China’s domestic aviation transport sector[J]. Journal of Transport Geography, 2019, 76: 71-82. doi: 10.1016/j.jtrangeo.2019.02.009 [3] 朱佳琳. 中国民用航空器碳排放时空演化特征及驱动因素研究[D]. 南京: 南京航空航天大学, 2020: 37-43.ZHU J L. Spatial-temporal evolution characteristics and driving factors of carbon emissions from civil aircraft in China[D]. Nanjing: Nanjing University of Aeronautics and Astronautics, 2020: 37-43(in Chinese). [4] HU R, ZHU J L, ZHANG Y, et al. Spatial characteristics of aircraft CO2 emissions at different airports: Some evidence from China[J]. Transportation Research Part D:Transport and Environment, 2020, 85: 102435. doi: 10.1016/j.trd.2020.102435 [5] LIU J G, LI S J, JI Q. Regional differences and driving factors analysis of carbon emission intensity from transport sector in China[J]. Energy, 2021, 224: 120178. doi: 10.1016/j.energy.2021.120178 [6] 曾晓莹, 邱荣祖, 林丹婷, 等. 中国交通碳排放及影响因素时空异质性[J]. 中国环境科学, 2020, 40(10): 4304-4313.ZENG X Y, QIU R Z, LIN D T, et al. Spatio-temporal heterogeneity of transportation carbon emissions and its influencing factors in China[J]. China Environmental Science, 2020, 40(10): 4304-4313(in Chinese). [7] 宋德勇, 徐安. 中国城镇碳排放的区域差异和影响因素[J]. 中国人口·资源与环境, 2011, 21(11): 8-14.SONG D Y, XU A. Regional difference and influential factors of China's urban carbon emissions[J]. China Population, Resources and Environment, 2011, 21(11): 8-14(in Chinese). [8] 王建伟, 李娉, 高洁. 中国交通运输碳减排区域划分[J]. 长安大学学报(自然科学版), 2012, 32(1): 72-77.WANG J W, LI P, GAO J. Region division in China for transportation carbon emission reduction[J]. Journal of Chang’an University (Natural Science Edition), 2012, 32(1): 72-77(in Chinese). [9] 武旭, 杜奕, 贾传峻. 基于全距离完全度量聚类的交通运输能耗区域划分[J]. 交通运输系统工程与信息, 2019, 19(2): 7-12.WU X, DU Y, JIA C J. Regionalization of China’s transportation energy consumption based on full-order-constrained complete linkage partitioning[J]. Journal of Transportation Systems Engineering and Information Technology, 2019, 19(2): 7-12(in Chinese). [10] 张彬, 姚娜, 刘学敏. 基于模糊聚类的中国分省碳排放初步分析[J]. 中国人口·资源与环境, 2011, 21(1): 53-56.ZHANG B, YAO N, LIU X M. Preliminary fuzzy clustering analysis on carbon emission in different provinces of China[J]. China Population, Resources and Environment, 2011, 21(1): 53-56(in Chinese). [11] 涂正革, 谌仁俊. 中国碳排放区域划分与减排路径: 基于多指标面板数据的聚类分析[J]. 中国地质大学学报(社会科学版), 2012, 12(6): 7-13.TU Z G, CHEN R J. Regional division of carbon emission and emission reduction path in China: Cluster analysis based on multi-index panel data[J]. Journal of China University of Geosciences (Social Sciences Edition), 2012, 12(6): 7-13(in Chinese). [12] CHANG K L, DU Z F, CHEN G J, et al. Panel estimation for the impact factors on carbon dioxide emissions: A new regional classification perspective in China[J]. Journal of Cleaner Production, 2021, 279: 123637. doi: 10.1016/j.jclepro.2020.123637 [13] 朱佳琳, 胡荣, 张军峰, 等. 中国航空器碳排放测算与演化特征研究[J]. 武汉理工大学学报(交通科学与工程版), 2020, 44(3): 558-563.ZHU J L, HU R, ZHANG J F, et al. Research on the measurement and evolution characteristics of aircraft carbon emissions in China[J]. Journal of Wuhan University of Technology (Transportation Science & Engineering), 2020, 44(3): 558-563(in Chinese). [14] 杨娟, 谢远涛. 面板数据聚类的复合方法与应用[M]. 北京: 对外经济贸易大学出版社, 2016: 19-20.YANG J, XIE Y T. Composite method and application of panel data clustering[M]. Beijing: University of International Business and Economics Press, 2016: 19-20(in Chinese). [15] 刘贤赵, 郭若鑫, 张勇, 等. 中国省域碳排放空间依赖结构的非参数估计及其实证分析[J]. 中国人口·资源与环境, 2019, 29(5): 40-51.LIU X Z, GUO R X, ZHANG Y, et al. Nonparametric estimation and empirical analysis of spatial dependence structure of provincial carbon emissions in China[J]. China Population, Resources and Environment, 2019, 29(5): 40-51(in Chinese). [16] FAVATI P, LOTTI G, MENCHI O, et al. Construction of the similarity matrix for the spectral clustering method: Numerical experiments[J]. Journal of Computational and Applied Mathematics, 2020, 375: 112795. doi: 10.1016/j.cam.2020.112795 [17] MUR A, DORMIDO R, DURO N, et al. Determination of the optimal number of clusters using a spectral clustering optimization[J]. Expert Systems with Applications, 2016, 65: 304-314. doi: 10.1016/j.eswa.2016.08.059 [18] 郭鹏程. 中国民航客运碳排放时空演变与影响因素研究[D]. 兰州: 西北师范大学, 2020: 31-34.GUO P C. Spatial-temporal evolution and influencing factors of carbon emissions of civil aviation passenger transport in China[D]. Lanzhou: Northwest Normal University, 2020: 31-34(in Chinese). [19] 胡荣, 王德芸, 冯慧琳, 等. 碳达峰视角下的机场航空器碳排放预测[J]. 交通运输系统工程与信息, 2021, 21(6): 257-263.HU R, WANG D Y, FENG H L, et al. Prediction of aircraft CO2 emission from perspective of CO2 emission peak[J]. Journal of Transportation Systems Engineering and Information Technology, 2021, 21(6): 257-263(in Chinese). -

 下载:
下载:

 点击查看大图
计量
- 文章访问数: 197
- HTML全文浏览量: 57
- PDF下载量: 13
- 被引次数: 0
