-
摘要:
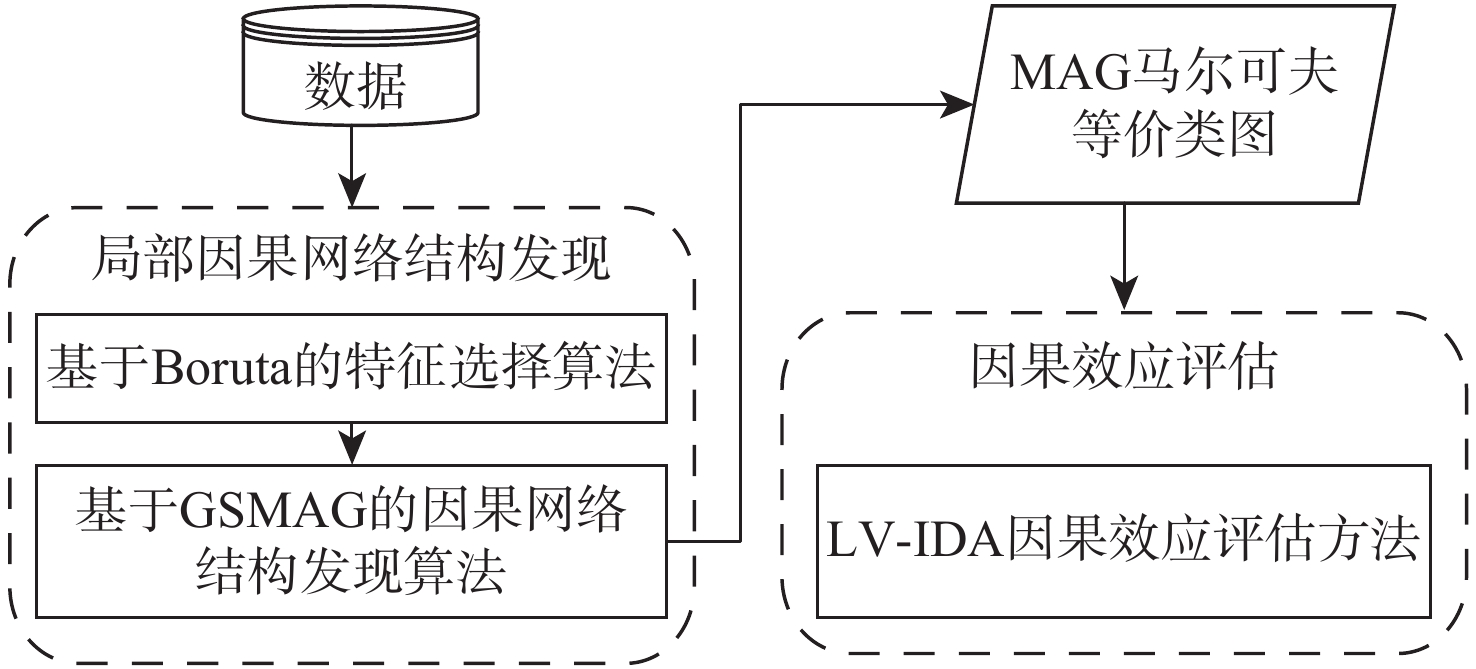
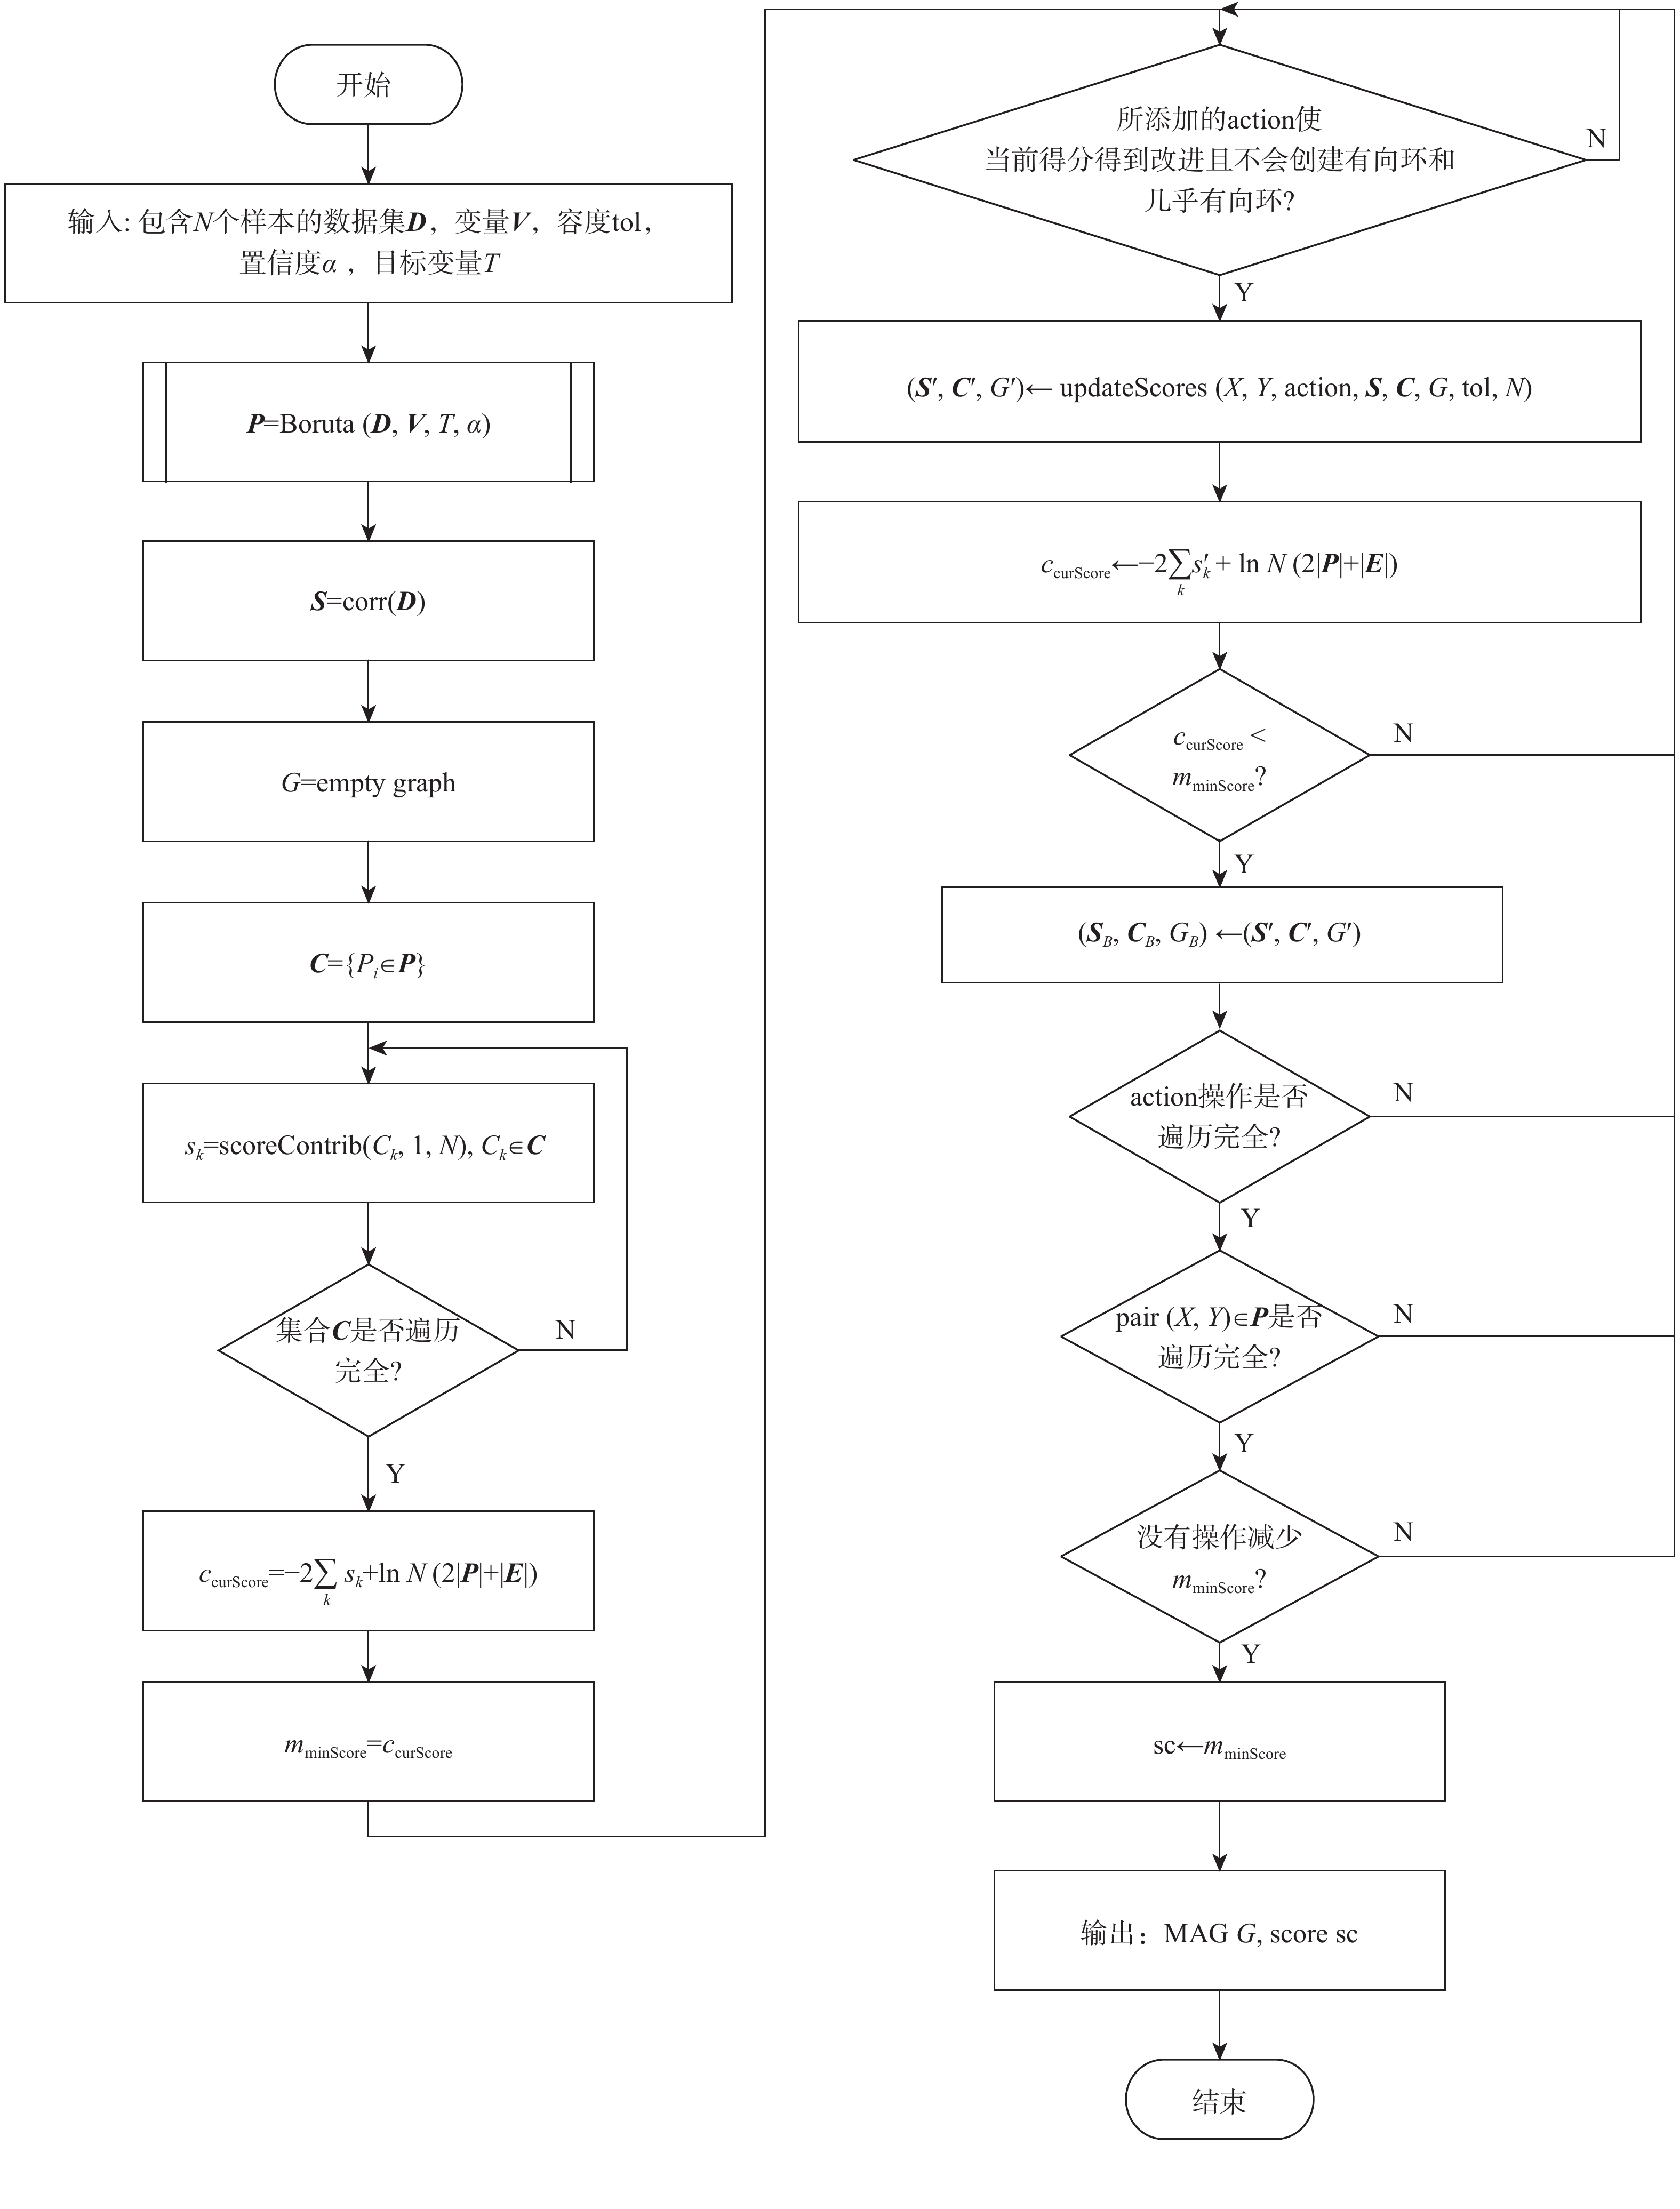
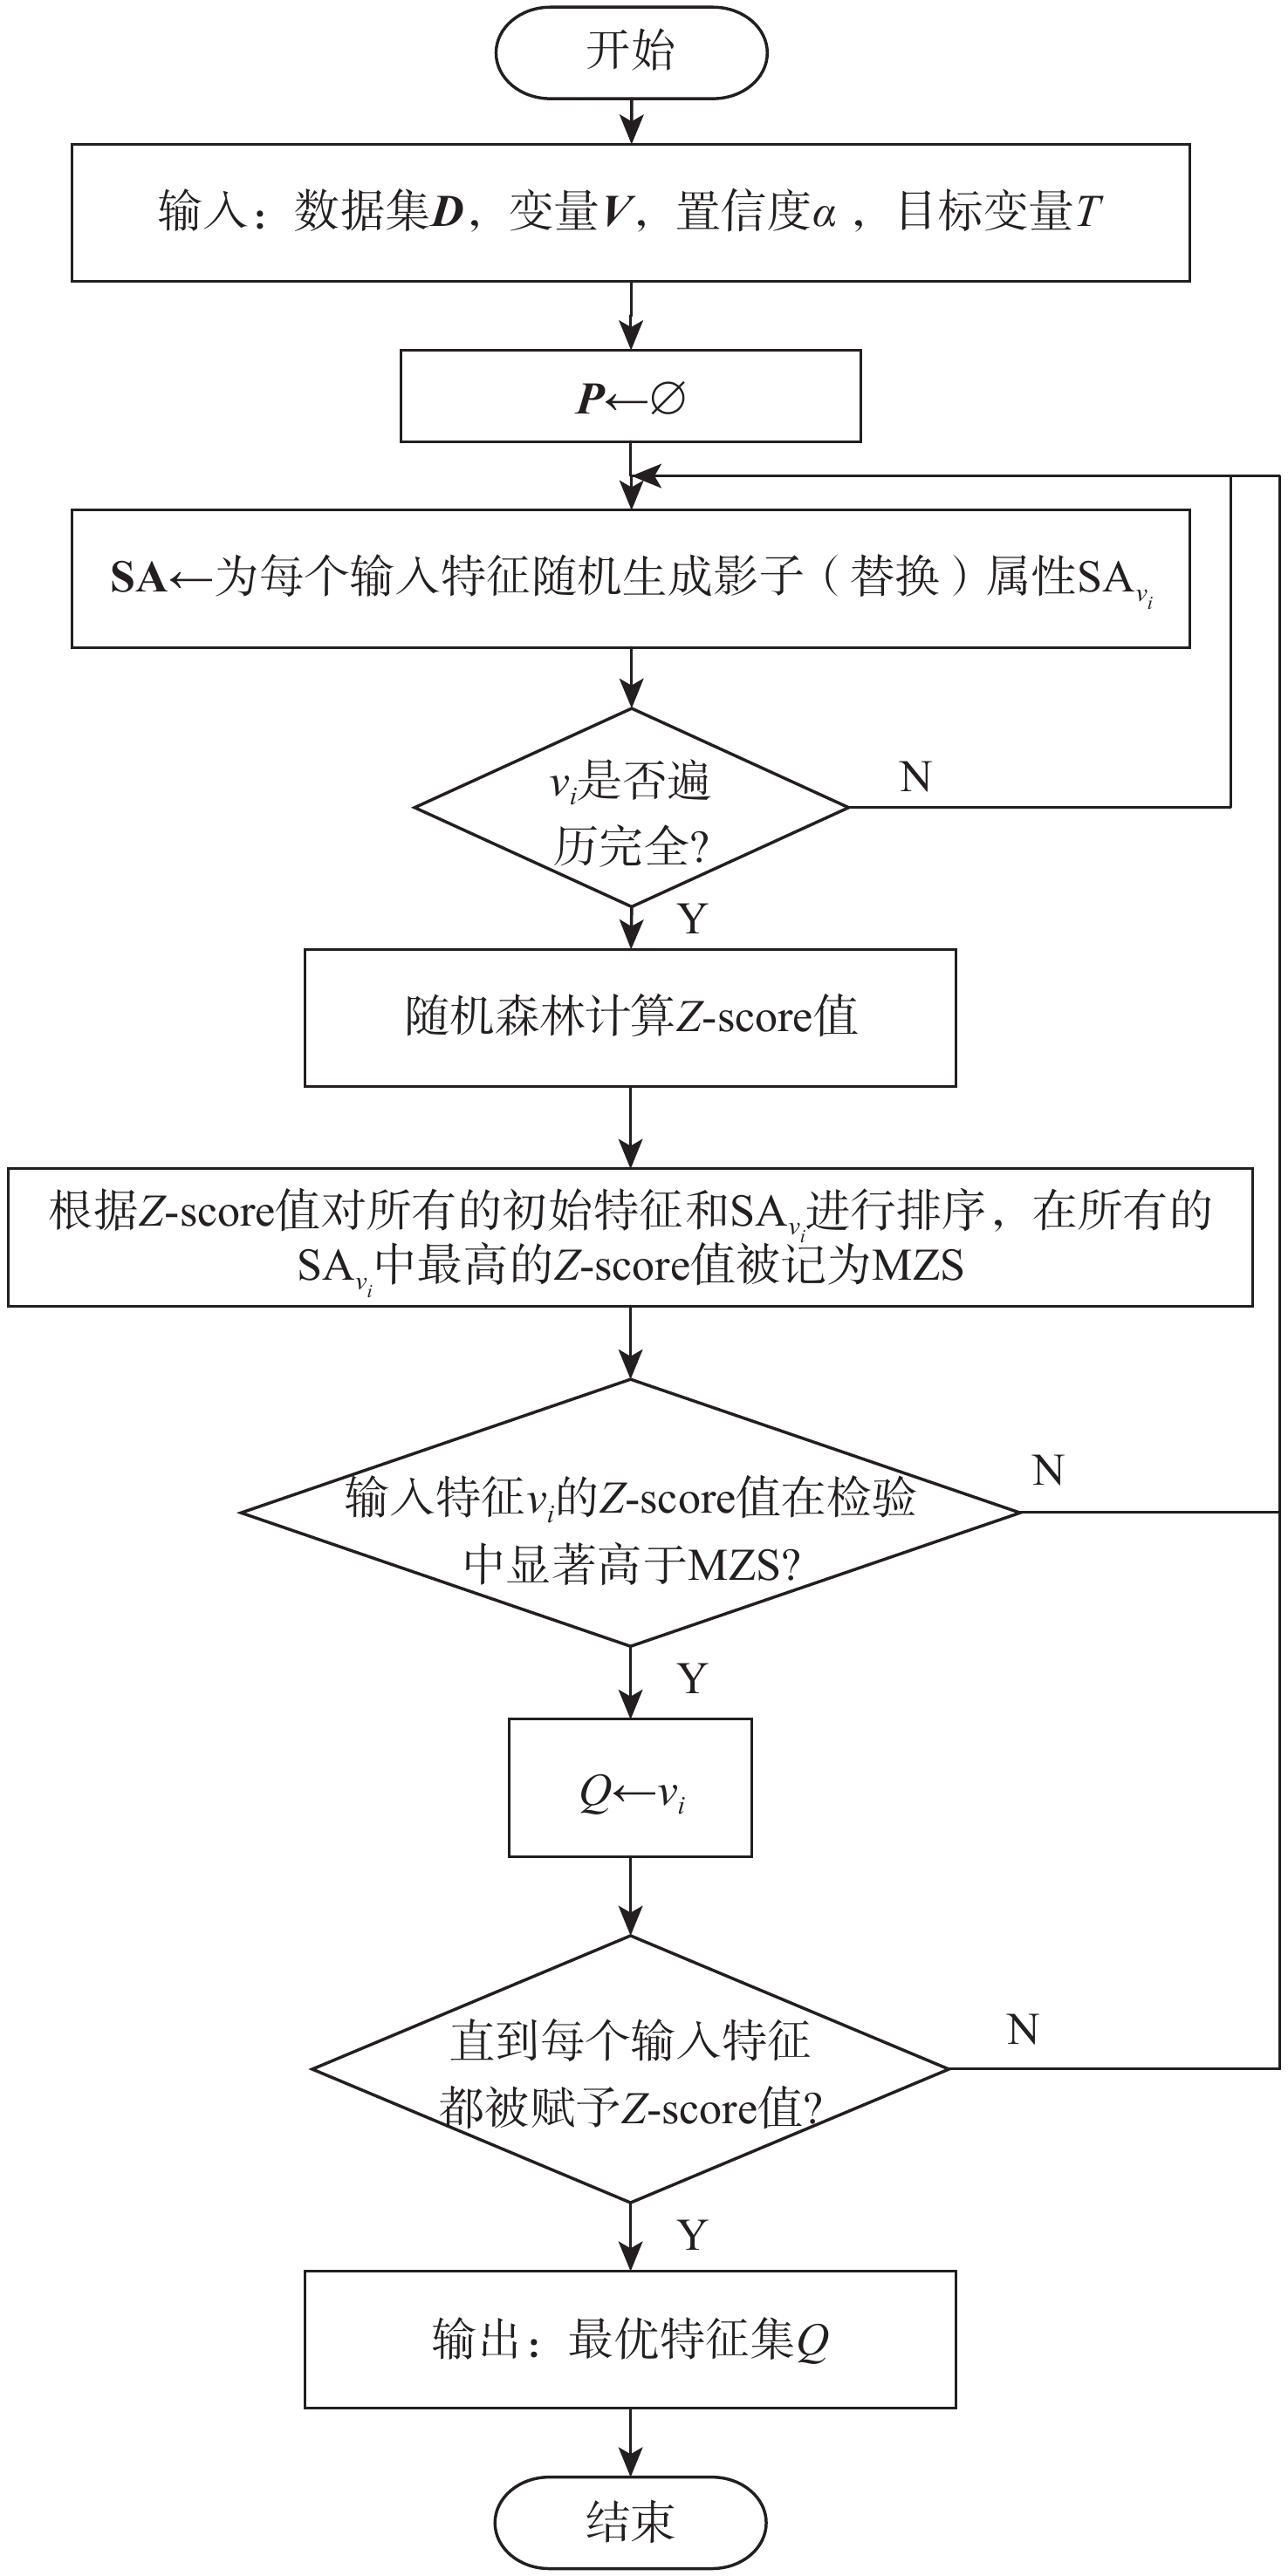
航班离港延误是民航界一致关注并希望解决的重点及难点问题。针对航班离港延误产生原因不明晰及因果影响强度不确定的问题,提出了BLCNS-LV-IDA因果分析框架,从因果推断的角度出发,在航班地面保障业务范畴领域内,从定性和定量2个层面对航班离港推出延误进行因果分析。以航班离港推出延误时长为目标变量,基于特征选择和极大祖先图贪婪搜索(GSMAG)算法结合的BLCNS局部因果网络结构发现算法,构建因果网络模型;根据得到的因果网络,基于LV-IDA算法对各等价网络中的边缘进行因果效应评估。实验结果表明:BLCNS局部因果网络结构发现算法在处理变量较多的大样本数据集时有一定的优势,在50节点集的1000、5000、10000样本量下,
F 1值较基线算法分别提高了−0.303、0.008、0.132,呈明显上升趋势,且在运行时间方面至少缩短16.29%。节点间的因果效应明确了各节点对航班延误的具体影响强度,为航班保障的精细化管理、减少航班延误提供了指导。Abstract:Flight departure delay is a key and difficult problem that the civil aviation industry is unanimously concerned about. Aiming at the problem of unclear reasons for flight delays, the BLCNS-LV-IDA causality analysis framework is proposed. In the discipline of flight ground support business, causal analysis of flight departure delays is done on both a qualitative and quantitative level from the standpoint of causal inference. Firstly, a causal network model is built with the departure delay time as the goal variable using the BLCNS local causal structure learning algorithm, which combines feature selection with greedy search for maximal ancestral graph (GSMAG). Secondly, the causal effect of each edge in each equivalent network is evaluated based on the LV-IDA algorithm according to the obtained causal network. The experimental results show that the BLCNS causality discovery method has certain advantages in dealing with large sample data sets of multiple variables. In a data set with 50 nodes, compared with the baseline algorithm, the
F 1 value of BLCNS increased by −0.303, 0.008, and 0.132, respectively, with sample sizes of 1000, 5000, and 10000. It presents a clear upward trend. In addition, the running time of BLCNS has been shortened by 16.29%. The causal effect between nodes clarifies the specific strength of each node's impact on flight delays. It provides guidance for the fine management of flight guarantees and reducing flight delays. -
表 2 5000条数据时BLCNS与M3HC算法的准确率、召回率、F1值和运行时间
Table 2. Accuracy, recall, F1 value and run time of BLCNS and M3HC algorithms in 5000 data
变量数量 准确率 召回率 F1 运行时间/s M3HC BLCNS M3HC BLCNS M3HC BLCNS M3HC BLCNS 10 0.738 0.750 0.682 1.000 0.709 0.857 4.386 1.899 20 0.412 0.389 0.354 0.304 0.381 0.341 8.668 5.601 50 0.632 0.600 0.520 0.560 0.571 0.579 17.699 14.815 表 1 1000条数据时BLCNS与M3HC算法的准确率、召回率、F1值和运行时间
Table 1. Accuracy, recall, F1 value and run time of BLCNS and M3HC algorithms in 1000 data
变量数量 准确率 召回率 F1 运行时间/s M3HC BLCNS M3HC BLCNS M3HC BLCNS M3HC BLCNS 10 0.312 0.500 0.272 0.750 0.291 0.600 4.263 1.157 20 0.317 0.397 0.266 0.394 0.289 0.396 6.032 2.705 50 0.470 0.130 0.384 0.111 0.423 0.12 14.992 5.038 表 3 10000条数据时BLCNS与M3HC算法的准确率、召回率、F1值和运行时间
Table 3. Accuracy, recall, F1 value and run time of BLCNS and M3HC algorithms in 10000 data
变量数量 准确率 召回率 F1 运行时间/s M3HC BLCNS M3HC BLCNS M3HC BLCNS M3HC BLCNS 10 0.632 0.464 0.558 0.375 0.593 0.415 4.839 2.337 20 0.442 0.333 0.366 0.500 0.400 0.404 12.178 6.087 50 0.520 0.636 0.428 0.570 0.469 0.601 22.839 16.150 表 4 航班保障各节点标识
Table 4. Identification of flight service nodes
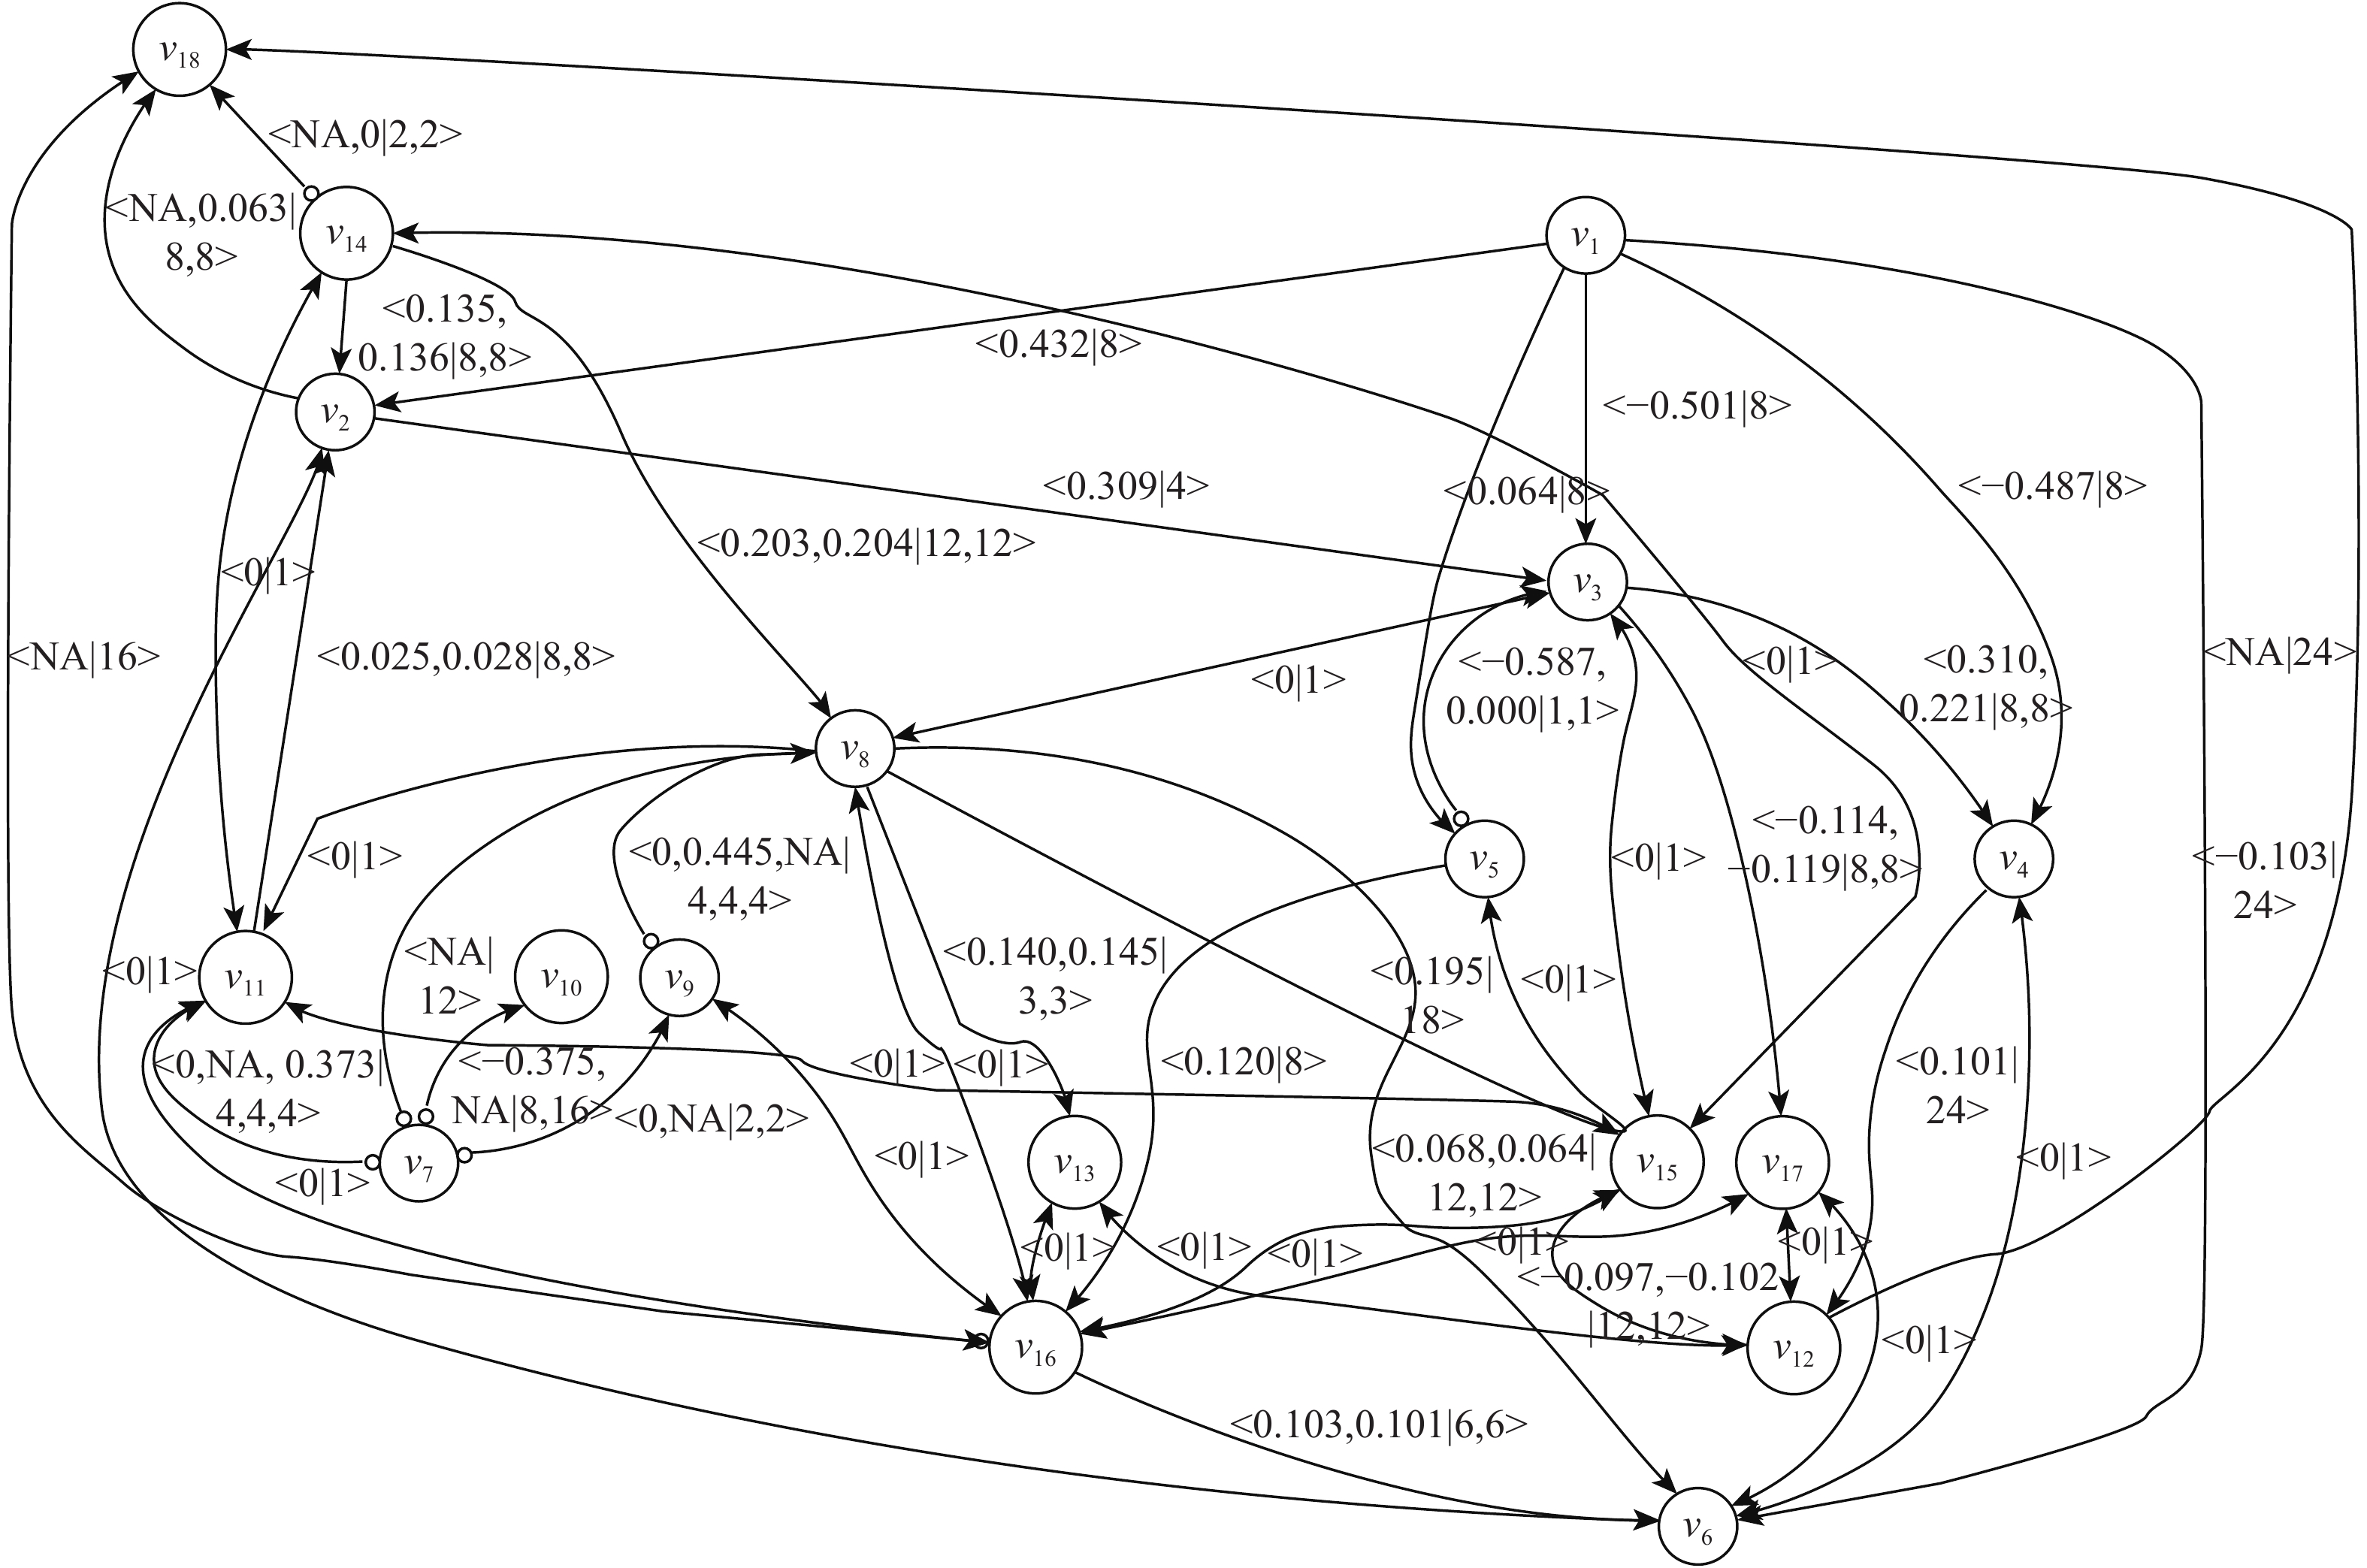
节点变量 节点含义 v1 机位变更—开始值机 v2 开始值机—到达本站 v3 开始值机—截止值机 v4 到达本站—进港桥电人员到位 v5 进港桥电人员到位—进港桥电车辆到位 v6 卸机人员到位—卸机车辆到位 v7 放行签字放行—开始登机 v8 装机关货舱门—上客登机结束 v9 进港桥电撤离设备—上客登机结束 v10 客舱清洁开始清洁—客舱清洁结束 v11 客舱清洁结束—上客开始登机 v12 上客开始登机—上客登机结束 v13 靠桥梯人员到位—靠桥梯廊桥检查 v14 上客人员到位—下客开舱门 v15 下客结束—上客车辆到位 v16 上客车辆到位—上客开始登机 v17 牵引车开始作业—牵引车作业结束 v18 航班延误 -
[1] 李彪, 王立文, 邢志伟. 过站航班地面保障流程效能评估[J]. 系统工程与电子技术, 2020, 42(7): 1543-1549. doi: 10.3969/j.issn.1001-506X.2020.07.16LI B, WANG L W, XING Z W. Effectiveness evaluation of ground support process for transit flight[J]. Systems Engineering and Electronics, 2020, 42(7): 1543-1549(in Chinese). doi: 10.3969/j.issn.1001-506X.2020.07.16 [2] RODRÍGUEZ-SANZ Á, COMENDADOR F G, VALDÉS R A, et al. Assessment of airport arrival congestion and delay: Prediction and reliability[J]. Transportation Research Part C:Emerging Technologies, 2019, 98: 255-283. doi: 10.1016/j.trc.2018.11.015 [3] 曹卫东. 基于改进贝叶斯网络结构学习的航班延误波及分析[D]. 天津: 天津大学, 2009.CAO W D. Flight delay propagation analysis based on improving Bayesian networks structure[D]. Tianjin: Tianjin University, 2009(in Chinese). [4] 许保光, 刘倩倩, 高敏刚. 基于机场繁忙程度的航班延误波及分析[J]. 中国管理科学, 2019, 27(8): 87-95.XU B G, LIU Q Q, GAO M G. The flight delay propagation analysis based on airport busy state[J]. Chinese Journal of Management Science, 2019, 27(8): 87-95(in Chinese). [5] 刘玉洁. 基于贝叶斯网络的航班延误与波及预测[D]. 天津: 天津大学, 2009.LIU Y J. Flight delay the estimation of flight delay and propagation based on Bayesian networks[D]. Tianjin: Tianjin University, 2009(in Chinese). [6] 周覃, 高强, 马农. 基于聚类分析和CHAID决策树算法的航班延误预测研究[J]. 武汉理工大学学报, 2017, 39(11): 32-40.ZHOU T, GAO Q, MA N. Flight delay prediction based on clustering analysis and CHAID decision tree algorithm[J]. Journal of Wuhan University of Technology, 2017, 39(11): 32-40(in Chinese). [7] REBOLLO J J, BALAKRISHNAN H. Characterization and prediction of air traffic delays[J]. Transportation Research Part C:Emerging Technologies, 2014, 44: 231-241. doi: 10.1016/j.trc.2014.04.007 [8] 陈超. 基于GP-LVM和LS-SVM航班延误等级预测研究[J]. 无线互联科技, 2020, 17(6): 10-11. doi: 10.3969/j.issn.1672-6944.2020.06.004CHEN C. Study on flight delay grade prediction based on GP-LVM and LS-SVM[J]. Wireless Internet Technology, 2020, 17(6): 10-11(in Chinese). doi: 10.3969/j.issn.1672-6944.2020.06.004 [9] KHANMOHAMMADI S, TUTUN S, KUCUK Y. A new multilevel input layer artificial neural network for predicting flight delays at JFK airport[C]//Conference on Engineering Cyber Physical Systems: Applying Theory to Practice. Berlin: Springer, 2016, 95: 237-244. [10] TRIANTAFILLOU S, TSAMARDINOS I. Score-based vs constraint-based causal learning in the presence of confounders[C]//Procecding of “Causation: Foundation to Application” Workshop, Uncertainty in Artificial Intelligence, 2016: 59-67. [11] AHMED A A M, DEO R C, GHAHRAMANI A, et al. LSTM integrated with Boruta-random forest optimiser for soil moisture estimation under RCP4.5 and RCP8.5 global warming scenarios[J]. Stochastic Environmental Research and Risk Assessment, 2021, 35: 1851-1881. [12] RICHARDSON T, SPIRTES P. Ancestral graph Markov models[J]. The Annals of Statistics, 2002, 30(4): 962-1030. [13] DRTON M, EICHLER M, RICHARDSON T S. Computing maximum likelihood estimates in recursive linear models with correlated errors[J]. Journal of Machine Learning Research, 2009, 10: 2329-2348. [14] TIAN J. Identifying direct causal effects in linear models[C]//Proceedings of the 20th National Conference on Artificial Intelligence. Reston: AIAA, 2005: 346-353. [15] RICHARDSON T S. A factorization criterion for acyclic directed mixed graphs[EB/OL]. (2014-06-26)[2021-11-01]. [16] NOWZOHOUR C, MAATHUIS M, BÜHLMANN P. Structure learning with bow-free acyclic path diagrams[EB/OL]. (2017-12-02)[2021-11-01]. [17] MAATHUIS M H, KALISCH M, BÜHLMANN P. Estimating high-dimensional intervention effects from observational data[J]. The Annals of Statistics, 2009, 37(6A): 3133-3164. [18] MALINSKY D, SPIRTES P. Estimating causal effects with ancestral graph Markov models[C]//Conference on Probabilistic Graphical Models. Brookline: Microsoft Publishing, 2016: 299-309. [19] MAATHUIS M H, COLOMBO D. A generalized back-door criterion[J]. The Annals of Statistics, 2015, 43(3): 1060-1088. [20] TSIRLIS K, LAGANI V, TRIANTAFILLOU S, et al. On scoring maximal ancestral graphs with the max-min hill climbing algorithm[J]. International Journal of Approximate Reasoning, 2018, 102: 74-85. doi: 10.1016/j.ijar.2018.08.002 -


 下载:
下载:


