


Evolution characteristics of China’s international air transport network under impact of COVID-19
-
摘要:
全球疫情形势下,各国国际航班政策变化、国际航线数量下降、国际客流量锐减对中国国际航线网络结构特征产生了重大影响,分析疫情下中国国际航线网络演化特征对于航空公司未来国际航线恢复和资源调配决策具有非常重要意义。采用K-Core网格划分算法对2019−2021年不同时期中国国际航线网络进行层级划分,通过分析各节点网络特征、所属层级和中转旅客份额等指标变化情况,确定节点和层级功能的转变,判断网络结构发展趋势。根据节点度、旅客运输量和感染人数对网络节点重要程度进行评估和排序,并通过依次移除节点的方式对网络进行蓄意攻击,分析不同层级网络的鲁棒性变化,识别疫情发展不同时期的关键节点。研究表明:在诸如旅客需求减少、国际航班政策等内外因素驱动下,国际航线网络结构和节点功能均发生改变,且部分改变是不可逆的,核心层与网络整体的连接性和主导作用逐步减弱,连接层的中转功能进一步加强,边缘层成为最具潜力的恢复市场。航空公司可以考虑与边缘层节点建立良好的连通关系,不仅可以维持突发情况下网络的正常运转,还可以在网络恢复期重建关键中转节点,提升国际客流份额。
Abstract:Under the global COVID-19 pandemic, the various international flight policies and the huge decline in international routes and passengers have had a significant impact on the structural characteristics of China’s international air transportation network. It is important to analyze the characteristics and evolution of China’s international air transportation network for airlines’ future international route recovery and resource allocation decisions. In this paper, the K-Core algorithm is used to decompose China’s international air transportation network into different layers from 2019 to 2021. By analyzing the characteristics, level belonging, and transit passenger share of each node, the different layer functions were determined and the development trend of the network structure was concluded. In addition, the network was purposefully assaulted by eliminating nodes one at a time in accordance with their node relevance. The nodes were ranked and appraised by taking into account node degree, passenger flow, and the number of infected persons. Therefore, the evolution of network robustness was analyzed which is helpful to identify the key nodes in different periods. It demonstrates how the network structure and node functions have changed, some of which will be irreversible, as a result of internal and external factors such as decreased passenger numbers and international flight policies. The connectivity and dominant role of the core layer on the entire network are gradually weakened, the transfer function of the bridge layer is further strengthened, and the periphery layer will become the most promising recovery market. Airlines can consider establishing stronger connectivity with these nodes, which can not only maintain the normal operation of the network in case of emergencies but also rebuild key transit nodes during the network recovery period and improve passenger demand.
-
Key words:
- air transport /
- network hierarchy /
- robustness /
- COVID-19 /
- international flight route
-
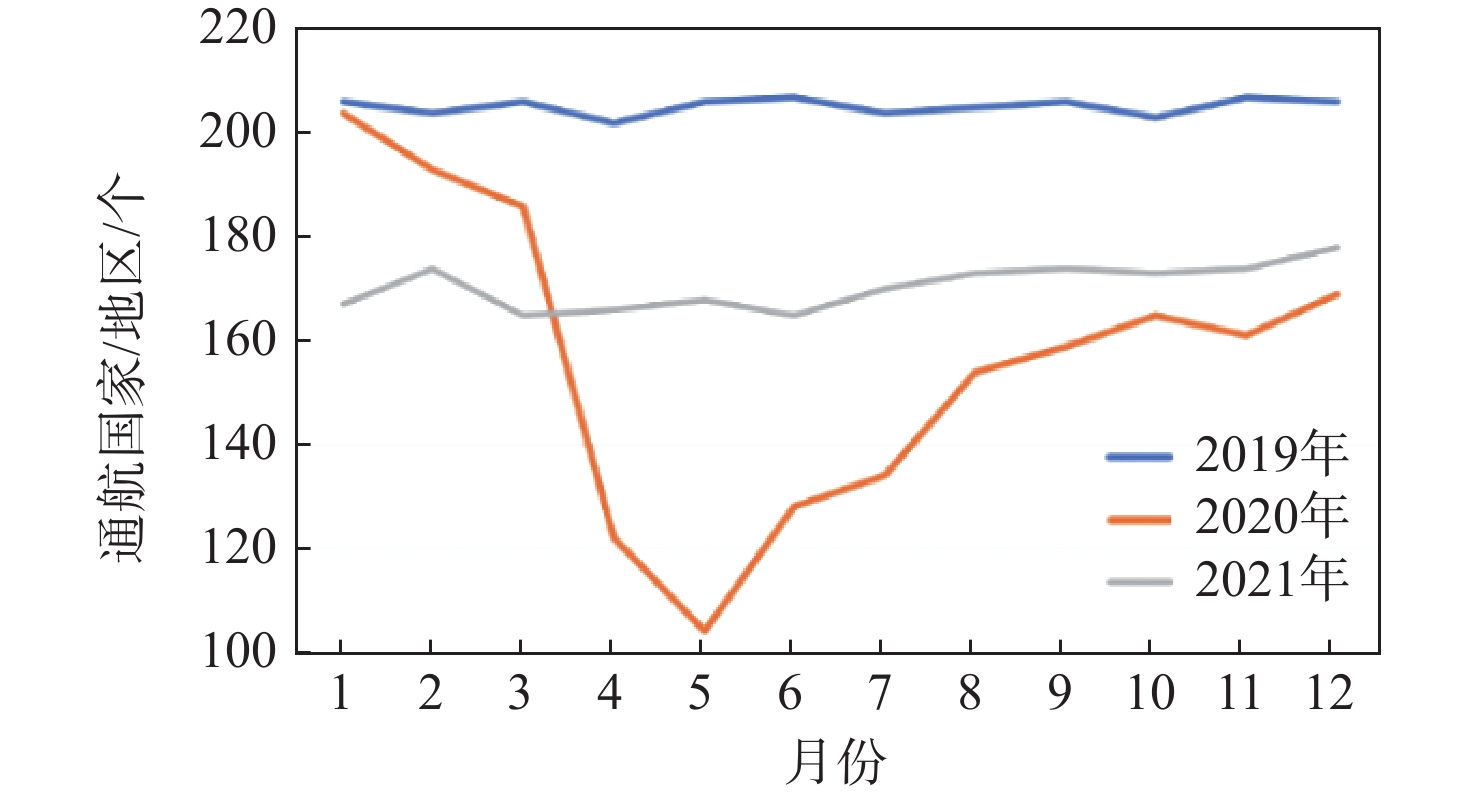
图 2 不同时期通航国家/地区数量
Figure 2. Number of connected countries/regions in different time period
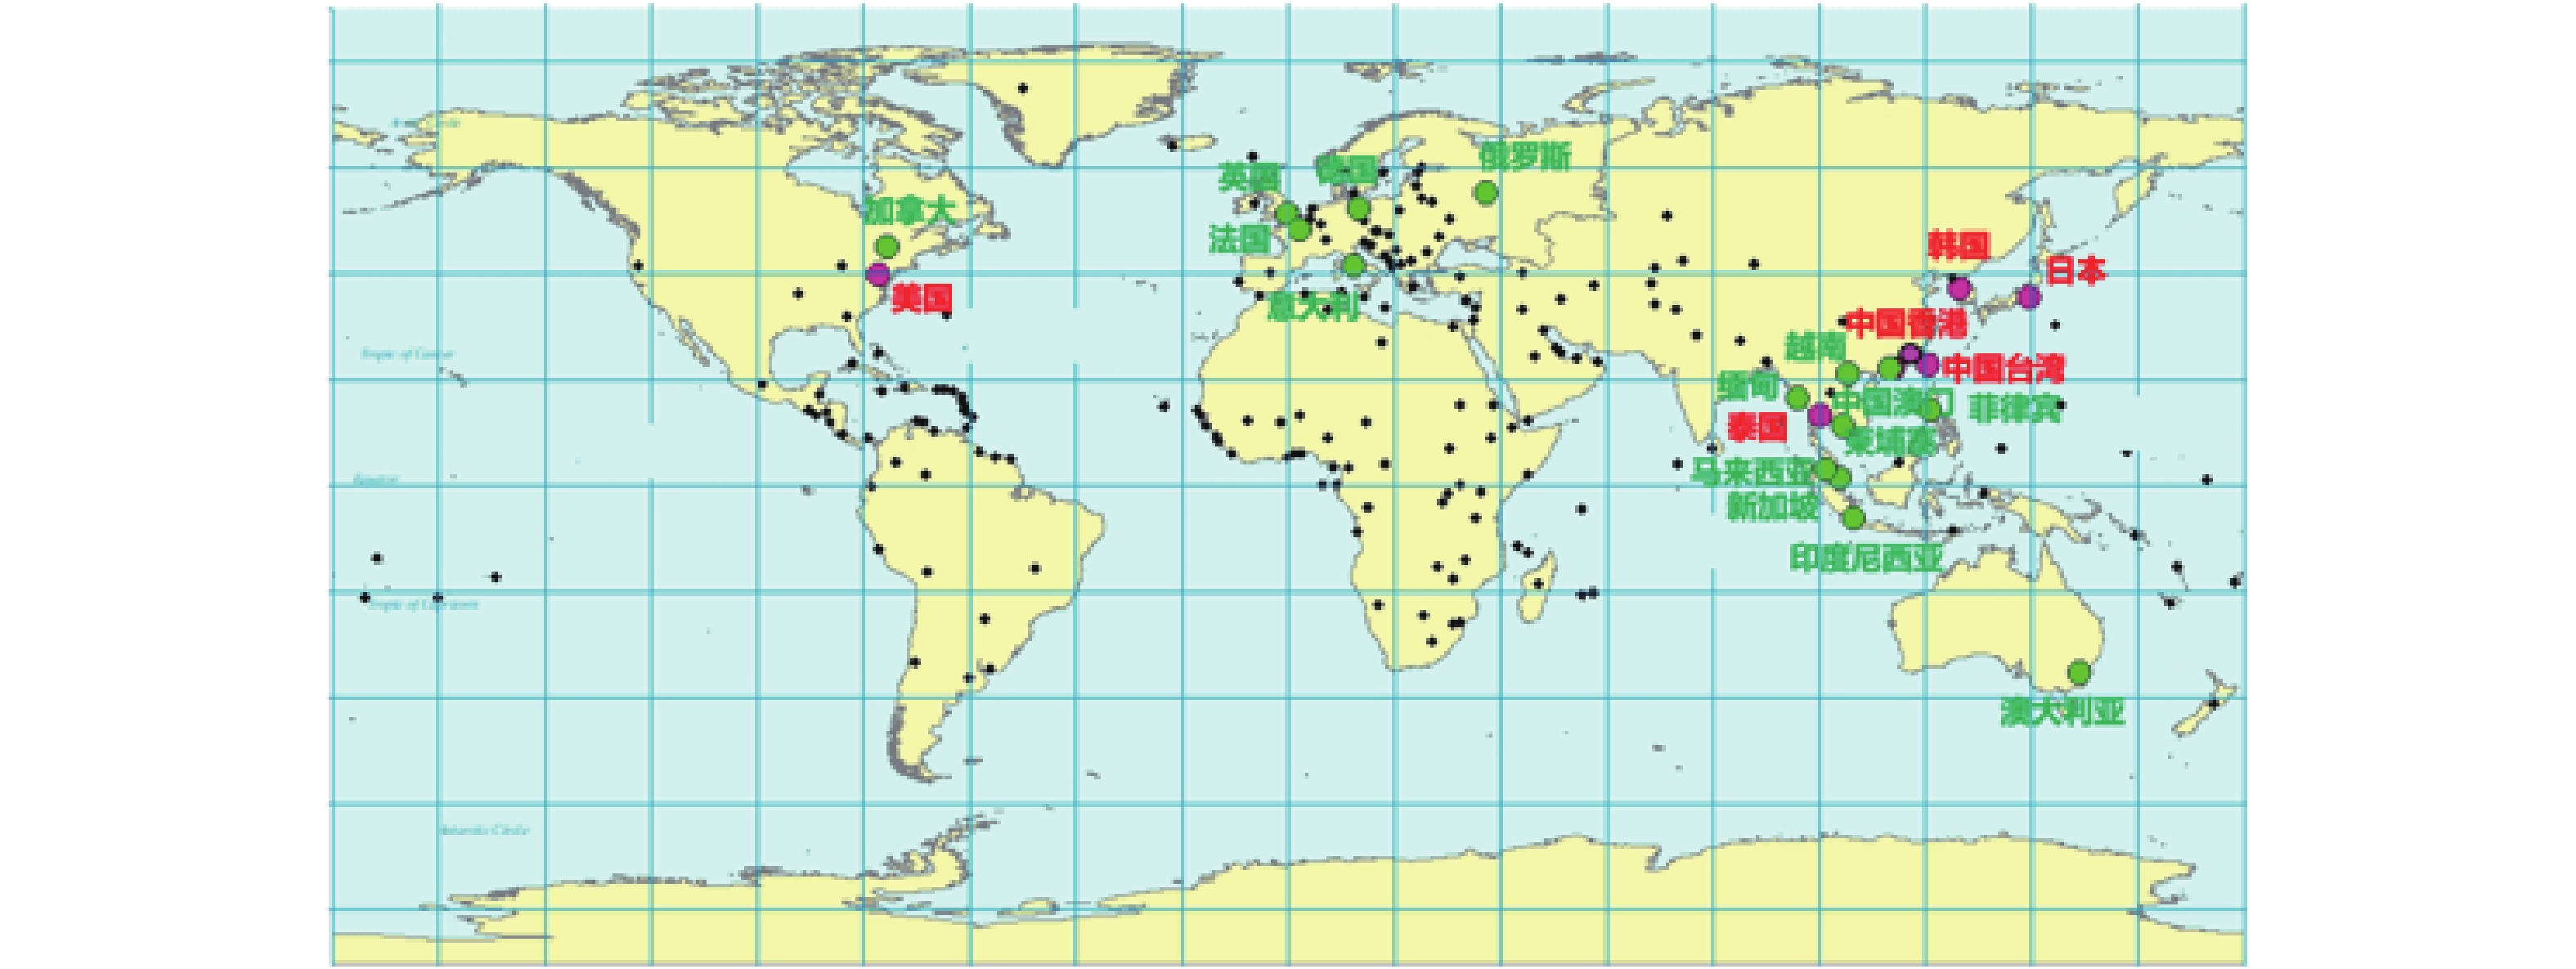
图 3 N0时期中国国际航线网络层级图
Figure 3. The hierarchy of China’s international air network in N0 period
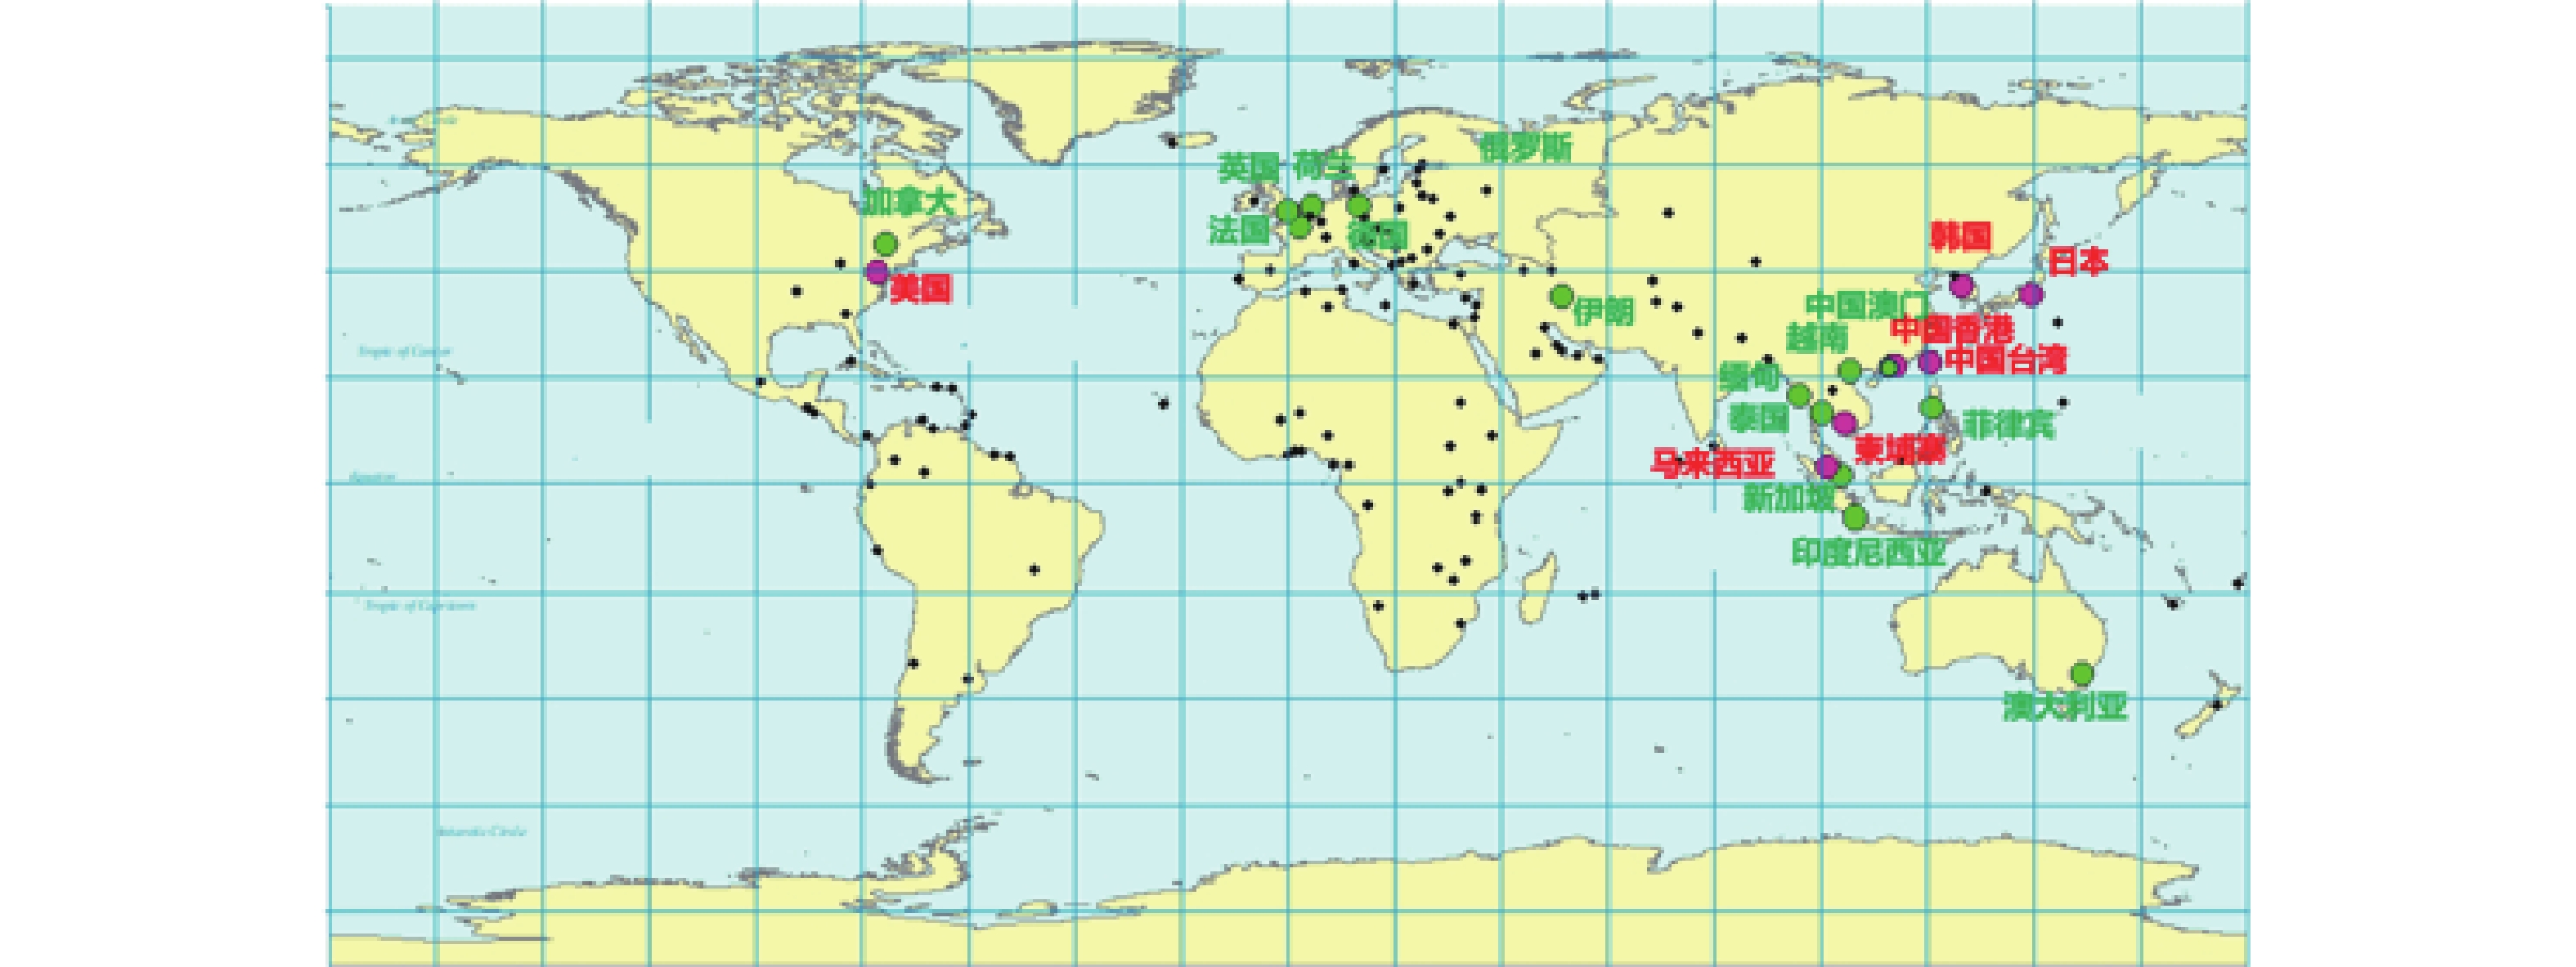
图 4 N1时期中国国际航线网络层级图
Figure 4. The hierarchy of China’s international air network in N1 period
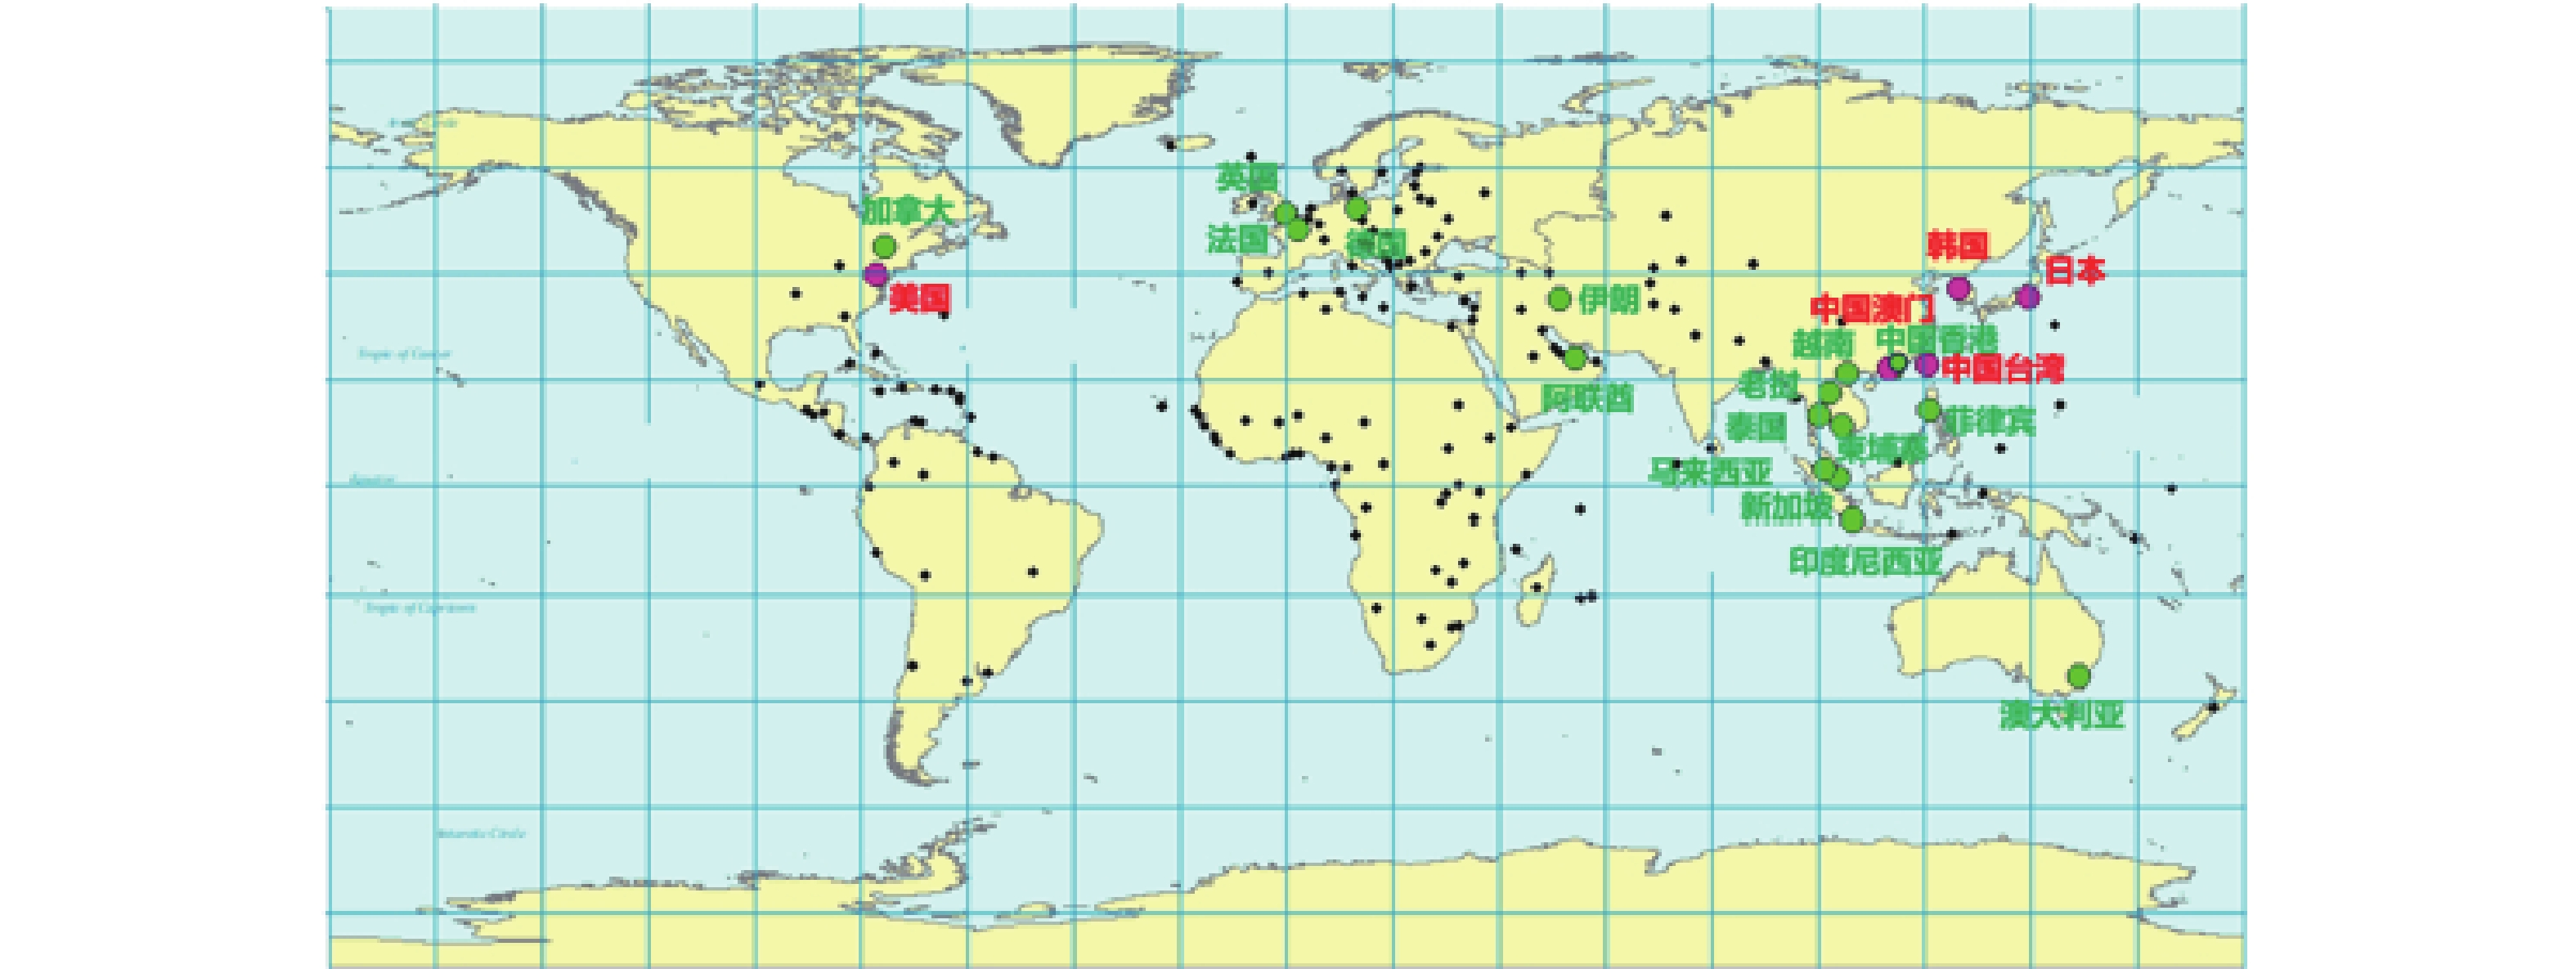
图 5 N2时期中国国际航线网络层级图
Figure 5. The hierarchy of China’s international air network in N2 period
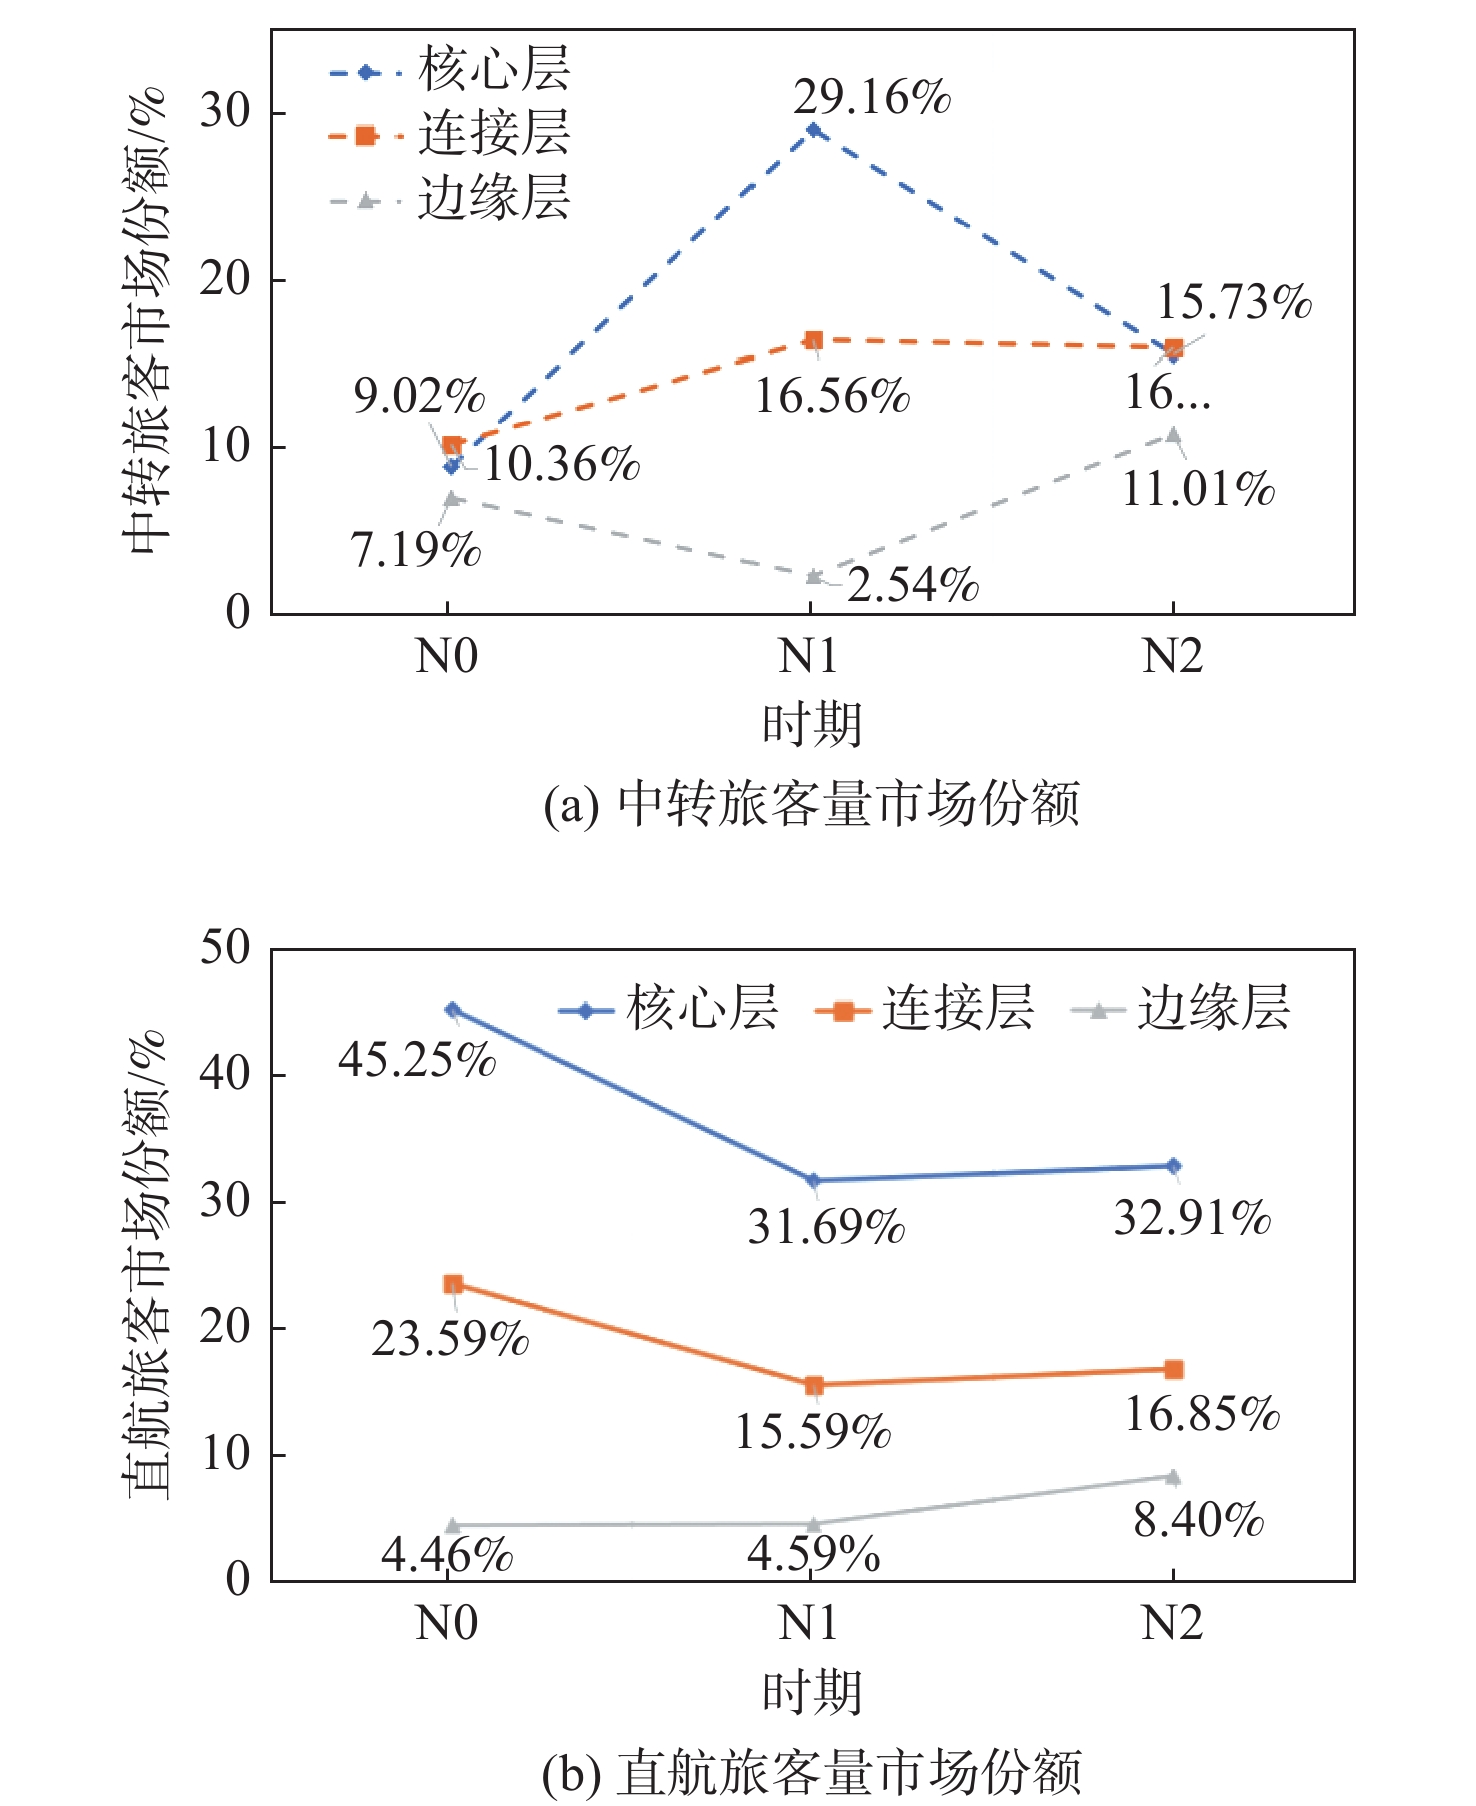
图 6 不同时期各层级直航和中转市场份额
Figure 6. Direct and indirect passenger share in each network-level during different time period
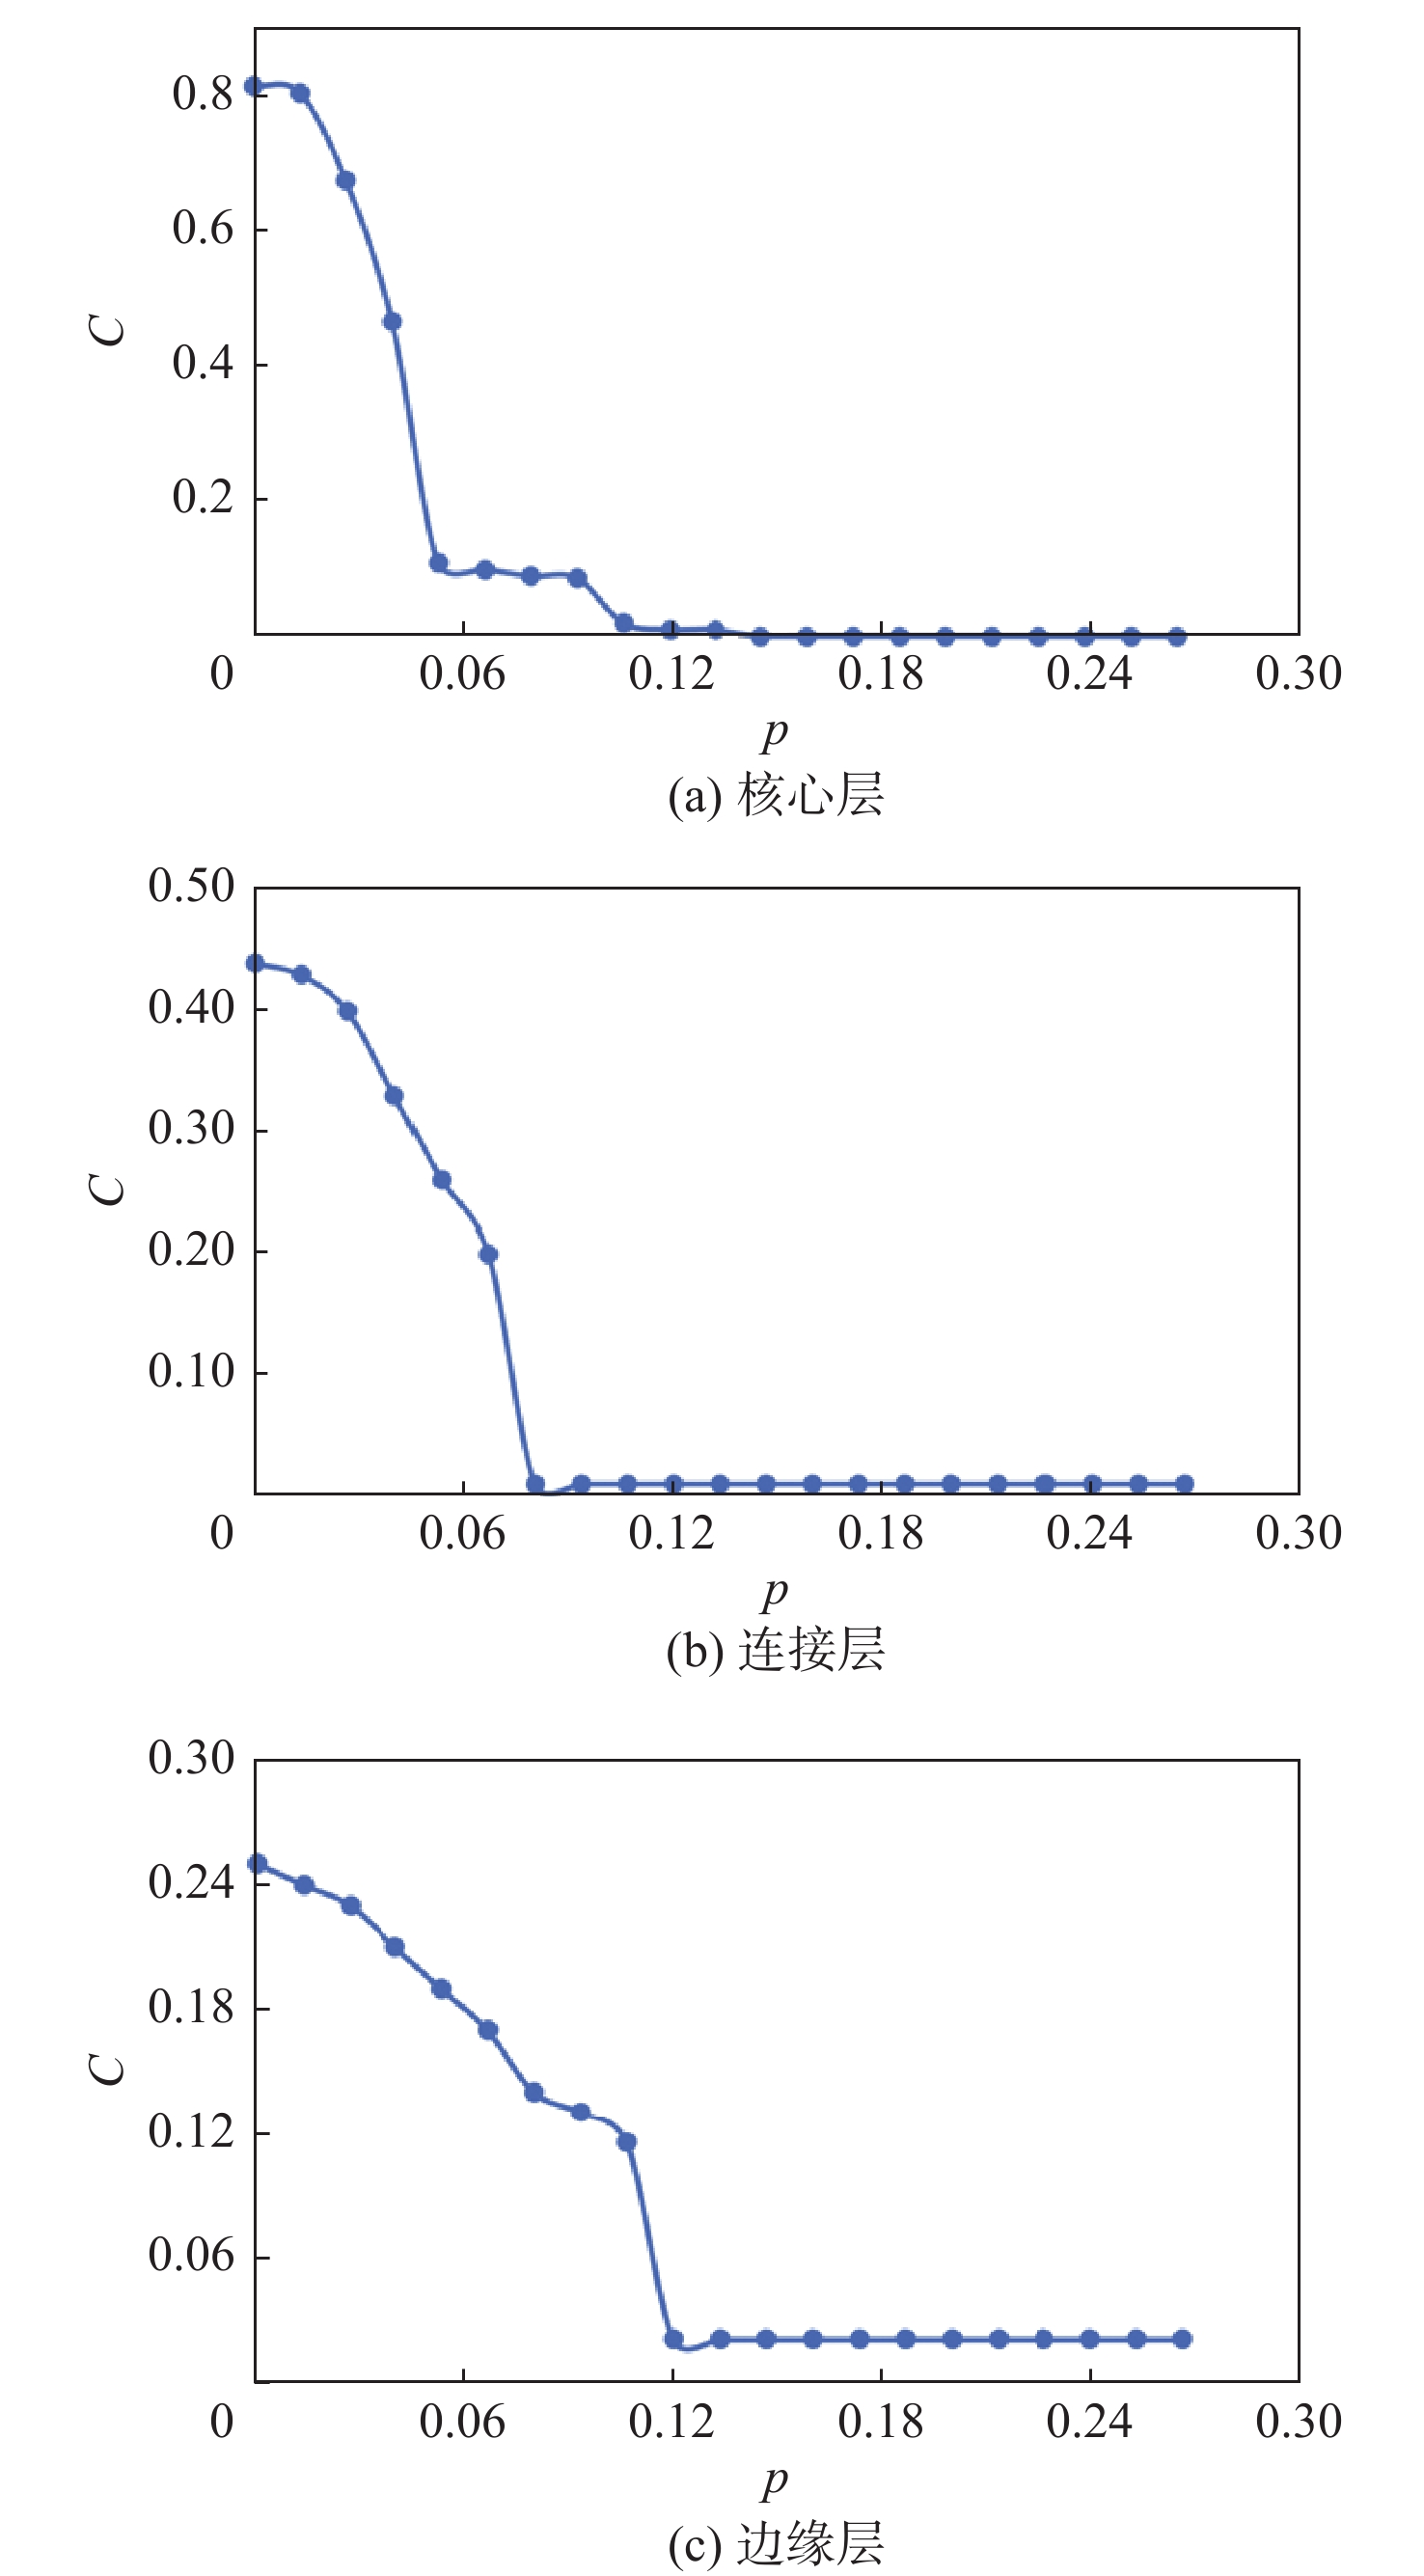
图 8 三个网络层级聚类系数C变化趋势
Figure 8. Change of clustering coefficient C in three network levels
表 1 研究阶段划分
Table 1. Division of research time period
网络
代码时间 通航国家/
地区数量旅客总量/
万人直航旅客
总量/万人N0 2019年4月 205 678.49 448.99 N1 2020年4月 122 22.59 11.69 N2 2021年4月 166 31.68 18.11  下载: 导出CSV
表 2 N0时期中国国际航线网络不同层级指标统计
Table 2. Statistics indexes of different China’s international air network-level in N0 period
层级 通航节点数 总节点度 平均节点度 直航旅客数/万人 中转旅客数/万人 核心层 6 463 77.17 306.95 61.24 连接层 15 1124 75.33 160.02 70.26 边缘层 184 4147 22.58 31.24 48.78
下载: 导出CSV
表 3 N1时期中国国际航线网络不同层级指标统计
Table 3. Statistics indexes of different China’s international air network-level in N1 period
层级 通航节点数量 总节点度 平均节点度 直航旅客数/万人 中转旅客数/万人 核心层 7 699 99.86 7.16 6.14 连接层 14 1172 83.71 3.52 3.74 边缘层 101 1458 14.43 1.01 1.02
下载: 导出CSV
表 4 N2时期中国国际航线网络不同层级指标统计
Table 4. Statistics indexes of different China’s international air network-level in N2 period
层级 通航节点数量 总节点度 平均节点度 直航旅客数/万人 中转旅客数/万人 核心层 5 652 130.4 10.43 4.98 连接层 16 2262 141.38 5.34 5.11 边缘层 145 16227 111.91 2.34 3.48
下载: 导出CSV
表 5 不同时期核心层和连接层节点及其重要度排名
Table 5. Node ranking in core layer and bridge layer during different period
N0时期 N1时期 N2时期 排名 国家/地区 所在层级 排名 国家/地区 所在层级 排名 国家/地区 所在层级 1 泰国 核心层 1 日本 核心层 1 中国澳门 核心层 2 日本 核心层 2 中国台湾 核心层 2 中国台湾 核心层 3 韩国 核心层 3 韩国 核心层 3 韩国 核心层 4 中国台湾 核心层 4 马来西亚 核心层 4 日本 核心层 5 美国 核心层 5 中国香港 核心层 5 美国 核心层 6 中国香港 核心层 6 柬埔寨 核心层 6 新加坡 连接层 7 新加坡 连接层 7 美国 核心层 7 伊朗 连接层 8 越南 连接层 8 泰国 连接层 8 柬埔寨 连接层 9 马来西亚 连接层 9 澳大利亚 连接层 9 泰国 连接层 10 柬埔寨 连接层 10 印度尼西亚 连接层 10 中国香港 连接层 11 俄罗斯 连接层 11 新加坡 连接层 11 马来西亚 连接层 12 印度尼西亚 连接层 12 加拿大 连接层 12 加拿大 连接层 13 中国澳门 连接层 13 菲律宾 连接层 13 澳大利亚 连接层 14 澳大利亚 连接层 14 法国 连接层 14 英国 连接层 15 菲律宾 连接层 15 伊朗 连接层 15 印度尼西亚 连接层 16 英国 连接层 16 英国 连接层 16 德国 连接层 17 加拿大 连接层 17 荷兰 连接层 17 越南 连接层 18 德国 连接层 18 越南 连接层 18 老挝 连接层 19 意大利 连接层 19 德国 连接层 19 菲律宾 连接层 20 法国 连接层 20 中国澳门 连接层 20 法国 连接层 21 缅甸 连接层 21 缅甸 连接层 21 阿联酋 连接层
下载: 导出CSV
表 6 通航国家/地区在不同层级的变化情况
Table 6. Entry and exit of countries/regions in different network levels
国家/地区 层级 N0时期 N1时期 N2时期 泰国 核心层 连接层 连接层 中国香港 核心层 核心层 连接层 马来西亚 连接层 核心层 连接层 柬埔寨 连接层 核心层 连接层 俄罗斯 连接层 边缘层 边缘层 意大利 连接层 边缘层 边缘层 缅甸 连接层 连接层 边缘层 荷兰 边缘层 连接层 边缘层 伊朗 边缘层 连接层 连接层 老挝 边缘层 边缘层 连接层 阿联酋 边缘层 边缘层 连接层 中国澳门 连接层 连接层 核心层
下载: 导出CSV
表 7 K值排名前20的通航国家/地区
Table 7. K value of top 20 countries/regions
序号 通航国家/地区 K值 序号 通航国家/地区 K值 1 美国 0.99997929 11 越南 0.99881269 2 中国澳门 0.99997907 12 老挝 0.99832669 3 日本 0.99975062 13 印度尼西亚 0.99808193 4 中国台湾 0.99955267 14 马来西亚 0.99796613 5 泰国 0.99950772 15 菲律宾 0.99766703 6 柬埔寨 0.99946235 16 加拿大 0.99386577 7 中国香港 0.99942212 17 法国 0.99244252 8 韩国 0.99941389 18 德国 0.99083292 9 新加坡 0.99923362 19 英国 0.98690199 10 澳大利亚 0.99899224 20 美国伊朗 0.98102768
下载: 导出CSV
-
[1] OAG. Coronavirus recovery tracker[EB/OL]. (2019-11-01)[2021-10-14]. [2] 傅超琦, 王瑛, 李超, 等. 不同增长机制下航空网络自愈特性[J]. 北京航空航天大学学报, 2018, 44(6): 1221-1229. doi: 10.13700/j.bh.1001-5965.2017.0485FU C Q, WANG Y, LI C, et al. Self-healing characteristics of aviation network under different growth mechanisms[J]. Journal of Beijing University of Aeronautics and Astronautics, 2018, 44(6): 1221-1229(in Chinese). doi: 10.13700/j.bh.1001-5965.2017.0485 [3] REN G J, ZHU J F, LU C Y. Identifying influential waypoints in air route networks based on network agglomeration relative entropy[J]. Chinese Journal of Physics, 2019, 57: 382-392. doi: 10.1016/j.cjph.2018.11.003 [4] ALAMSYAH A, RAMADHANI D P. Air transportation network robustness under random and hub-based disruptions[C]//2019 7th International Conference on Information and Communication Technology . Piscataway: IEEE Press, 2019: 1-6. [5] CHEN Y, WANG J E, JIN F J. Robustness of China’s air transport network from 1975 to 2017[J]. Physica A:Statistical Mechanics and Its Applications, 2020, 539: 122876. doi: 10.1016/j.physa.2019.122876 [6] 李航, 刘馨营, 张盈斐, 等. 空间灾害下中欧航空运输网络的脆弱性比较研究[J]. 南京航空航天大学学报(英文版), 2020, 37(2): 300-310. doi: 10.16356/j.1005-1120.2020.02.011LI H, LIU X Y, ZHANG Y F, et al. Comparison on vulnerability of European and Chinese air transport networks under spatial hazards[J]. Transactions of Nanjing University of Aeronautics and Astronautics, 2020, 37(2): 300-310(in Chinese). doi: 10.16356/j.1005-1120.2020.02.011 [7] YANG Y, XU K J, HONG C. Network dynamics on the Chinese air transportation multilayer network[J]. International Journal of Modern Physics C, 2021, 32(5): 2150070. doi: 10.1142/S0129183121500704 [8] DU W B, ZHOU X L, LORDAN O, et al. Analysis of the Chinese Airline Network as multi-layer networks[J]. Transportation Research Part E:Logistics and Transportation Review, 2016, 89: 108-116. doi: 10.1016/j.tre.2016.03.009 [9] 李航, 胡小兵. 一种改进的民用航空网络空间脆弱性模型[J]. 交通运输系统工程与信息, 2018, 18(4): 202-208. doi: 10.16097/j.cnki.1009-6744.2018.04.030LI H, HU X B. An improved spatial vulnerability model for civil aviation network[J]. Journal of Transportation Systems Engineering and Information Technology, 2018, 18(4): 202-208(in Chinese). doi: 10.16097/j.cnki.1009-6744.2018.04.030 [10] VERMA T, ARAÚJO N A M, HERRMANN H J. Revealing the structure of the world airline network[J]. Scientific Reports, 2014, 4: 5638. doi: 10.1038/srep05638 [11] DAI L, DERUDDER B, LIU X J. The evolving structure of the Southeast Asian air transport network through the lens of complex networks, 1979-2012[J]. Journal of Transport Geography, 2018, 68: 67-77. doi: 10.1016/j.jtrangeo.2018.02.010 [12] 彭挺. 层级式航空网络结构性能优化研究[D]. 哈尔滨: 哈尔滨工业大学, 2017.PENG T. Structural performance optimization of hierarchical airline network[D]. Harbin: Harbin Institute of Technology, 2017 (in Chinese). [13] 乐美龙, 郑文娟, 吴明功, 等. 不确定需求下航空公司枢纽网络优化设计[J]. 北京航空航天大学学报, 2020, 46(4): 674-682. doi: 10.13700/j.bh.1001-5965.2019.0319LE M L, ZHENG W J, WU M G, et al. Airline hub network optimization design under uncertain demand[J]. Journal of Beijing University of Aeronautics and Astronautics, 2020, 46(4): 674-682(in Chinese). doi: 10.13700/j.bh.1001-5965.2019.0319 [14] AMIEL M, MELANCON G, ROZENBLAT C. Multi-level networks: International flows of airline passengers[J]. Mappemonde, 2005, 79(1): 1-10. [15] 中国民用航空局. “五个一”国际航班政策[EB/OL]. (2020-03-30)[2021-10-18].Civil Aviation Administration of China. "Five Ones" International Flight Policy [EB/OL]. (2020-03-30)[2021-10-18]. (in Chinese). [16] Deep Acknowledge Analysis. Deep tech focused analysis agency [EB/OL] . (2020-08-16)[2021-10-18]. [17] HAIDER N, YAVLINSKY A, SIMONS D, et al. Passengers' destinations from China: Low risk of Novel Coronavirus (2019-nCoV) transmission into Africa and South America[J]. Epidemiology and Infection, 2020, 148: e41. doi: 10.1017/S0950268820000424 -

 下载:
下载:

 点击查看大图
计量
- 文章访问数: 284
- HTML全文浏览量: 410
- PDF下载量: 18
- 被引次数: 0
