


Incremental computing methods of canonical correlation analysis for compositional data streams
-
摘要:
成分数据典型相关分析(CCAI)是一种研究多个成分数据变量之间线性相关关系的方法,在经济、管理、地质、化学等多个领域应用广泛。在海量数据背景下,研究如何针对成分数据流展开典型相关建模分析,具有重要的理论意义和实用价值。为此,提出了成分数据典型相关分析的增量方法,通过对增量成分数据的协方差分解,实现对成分数据流典型相关性的精确计算。同时,给出序贯式和并行式2种分块增量算法,可处理多组成分数据的数据流建模问题,序贯式分块增量算法,按照数据流的先后顺序进行计算,并行式分块增量算法可以达到提高计算效率的目的。通过对不同概率分布和样本规模的成分数据流的仿真研究及微博假新闻的实例分析,验证了所提算法相比于传统的非增量算法,在保证计算准确性的前提下,具有提高运算效率的优势。
Abstract:The approach of connecting linear correlations between several sets of multidimensional compositional variables known as canonical correlation analysis (CCA) for compositional data streams is widely applicable to the study of economics, administration, geology, and chemistry. In the context of massive data, it is of great significance to study how to perform CCA for compositional data streams. Propose an incremental modeling method for the CCA on compositional data streams, which provides accurate results based on the decomposition of the covariance matrix. Furthermore, two incremental modeling methods for compositional data streams are also derived. The first is the sequential block algorithm, which conducts CCA in the order of data stream blocks. The second is the parallel block algorithm, which can improve the calculating efficiency. The proposed methods do indeed outperform non-incremental ones in terms of running time while maintaining the accuracy of canonical correlation computing, according to extensive simulation studies on compositional data with various sample sizes and probability distributions.
-
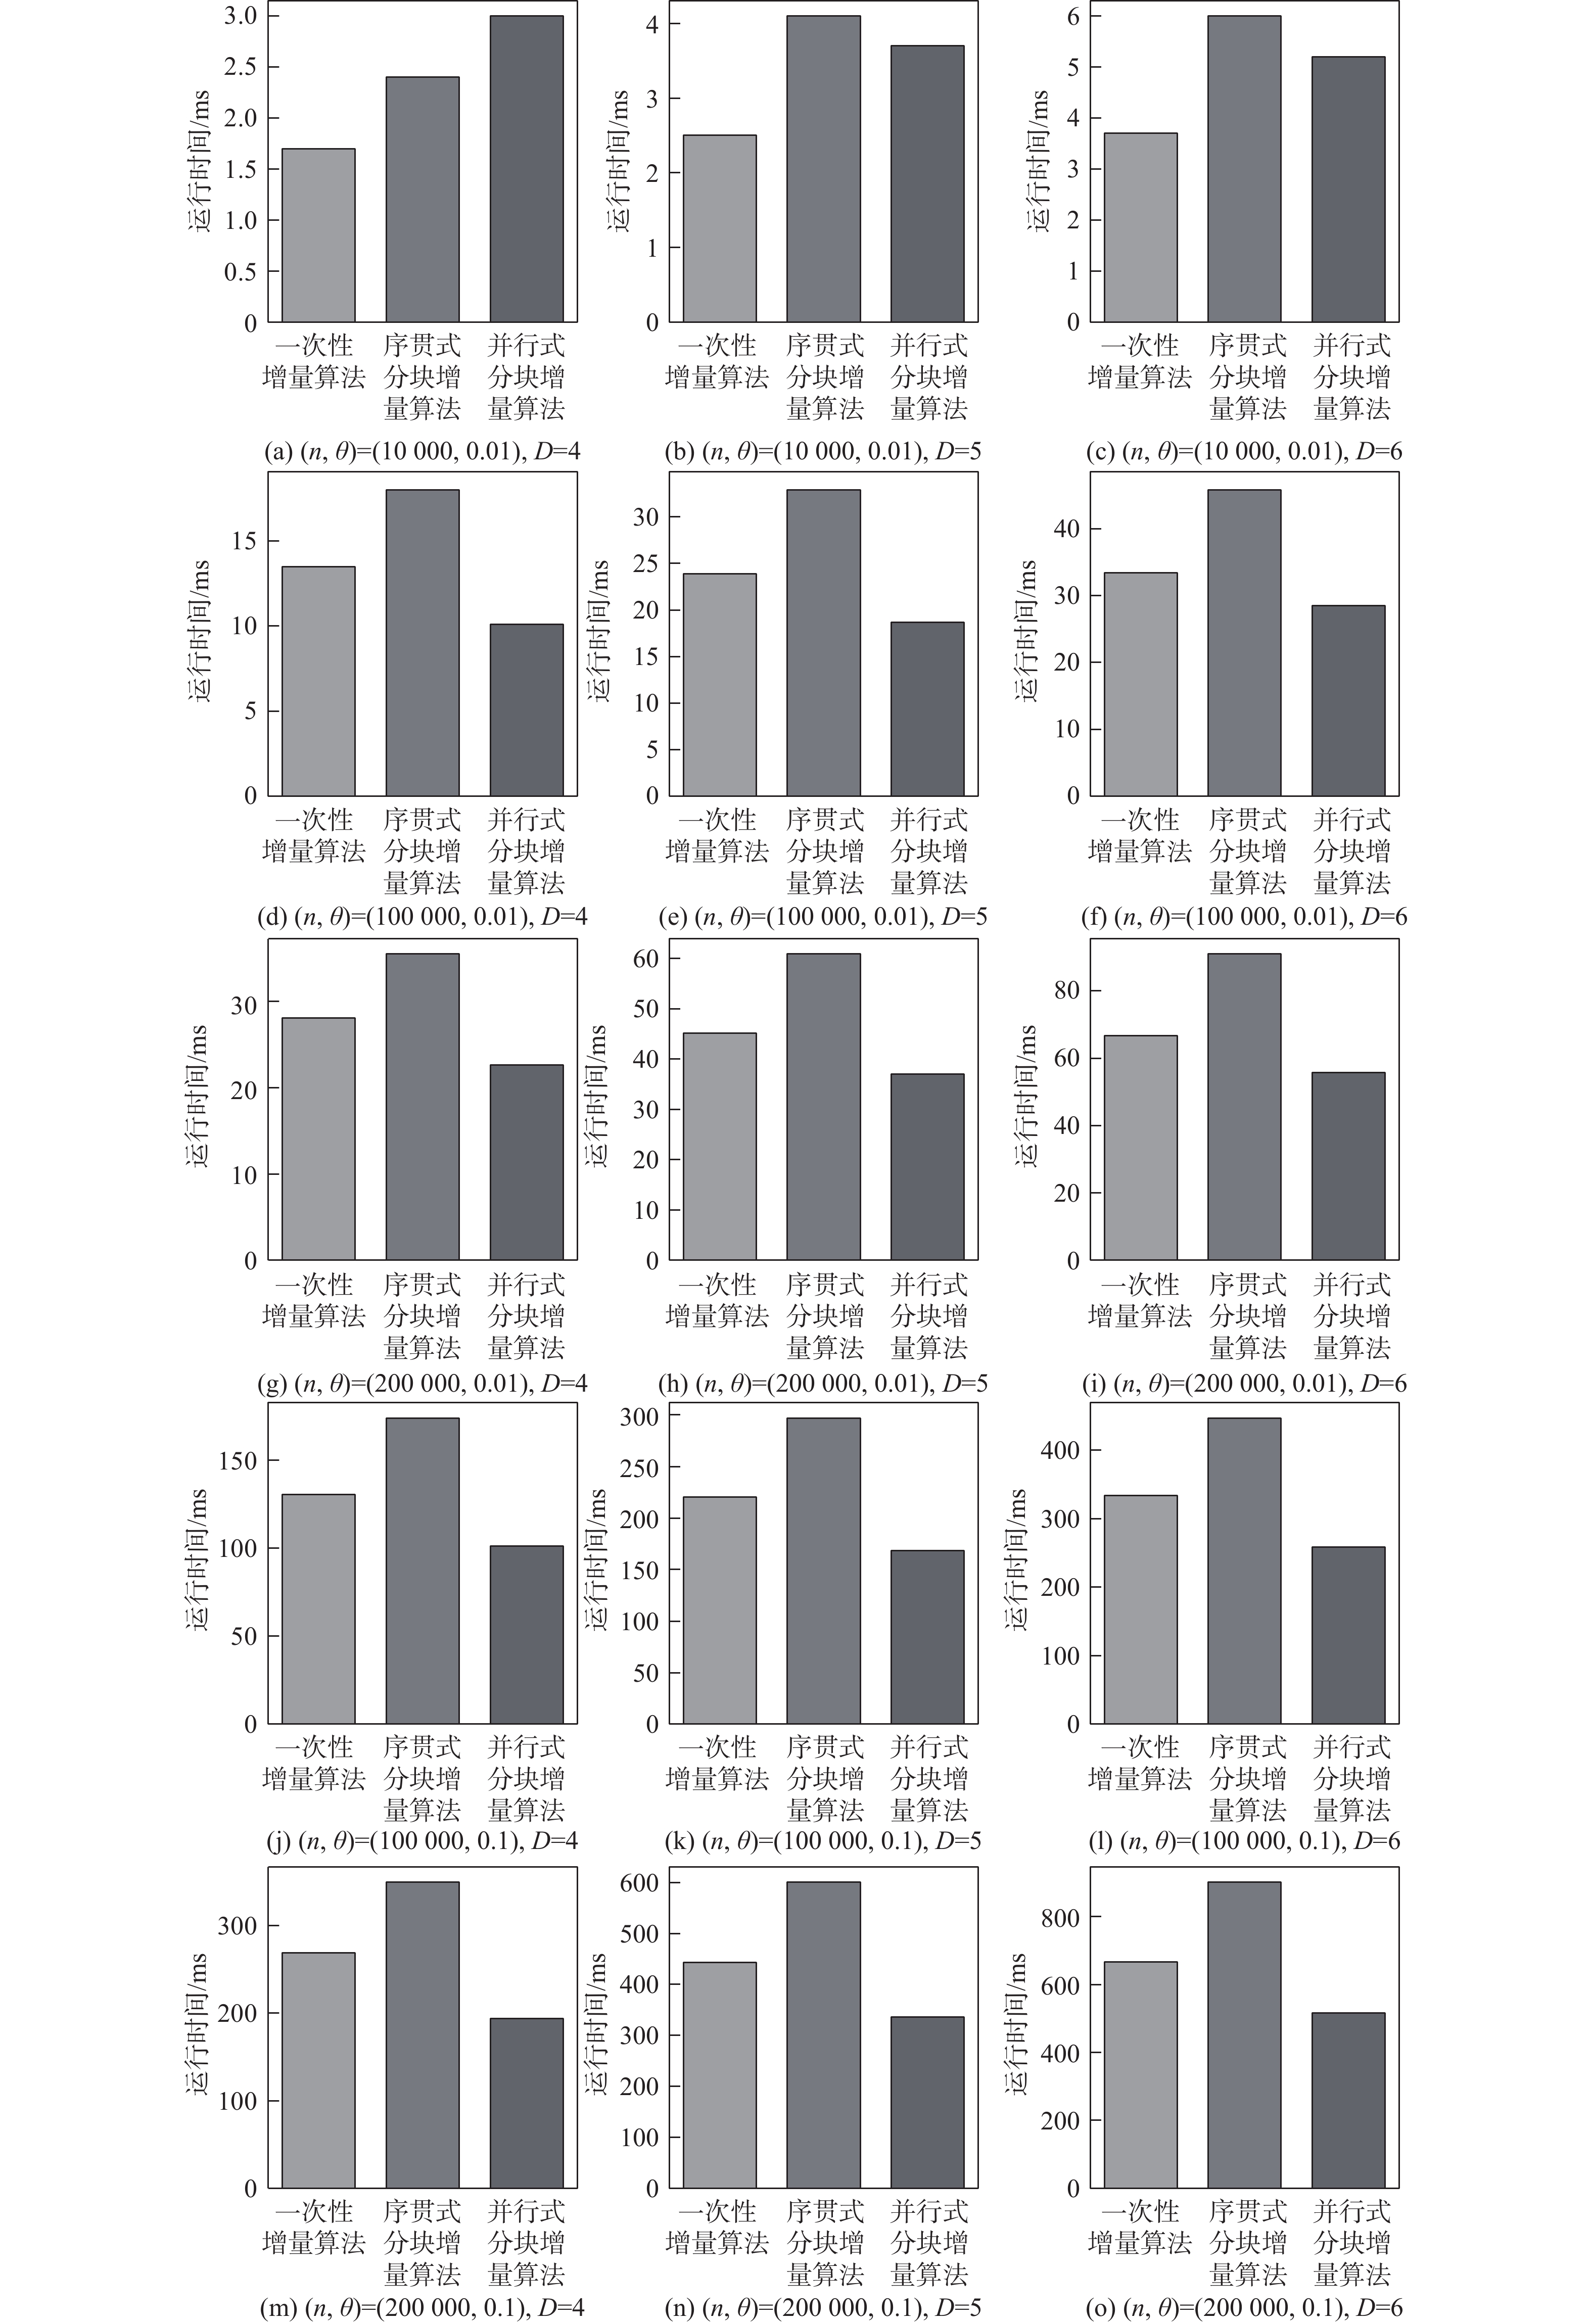
图 1 对成分数据采用3种增量算法的时间对比
Figure 1. Comparison of running time of CCA for compositional data with three different incremental methods
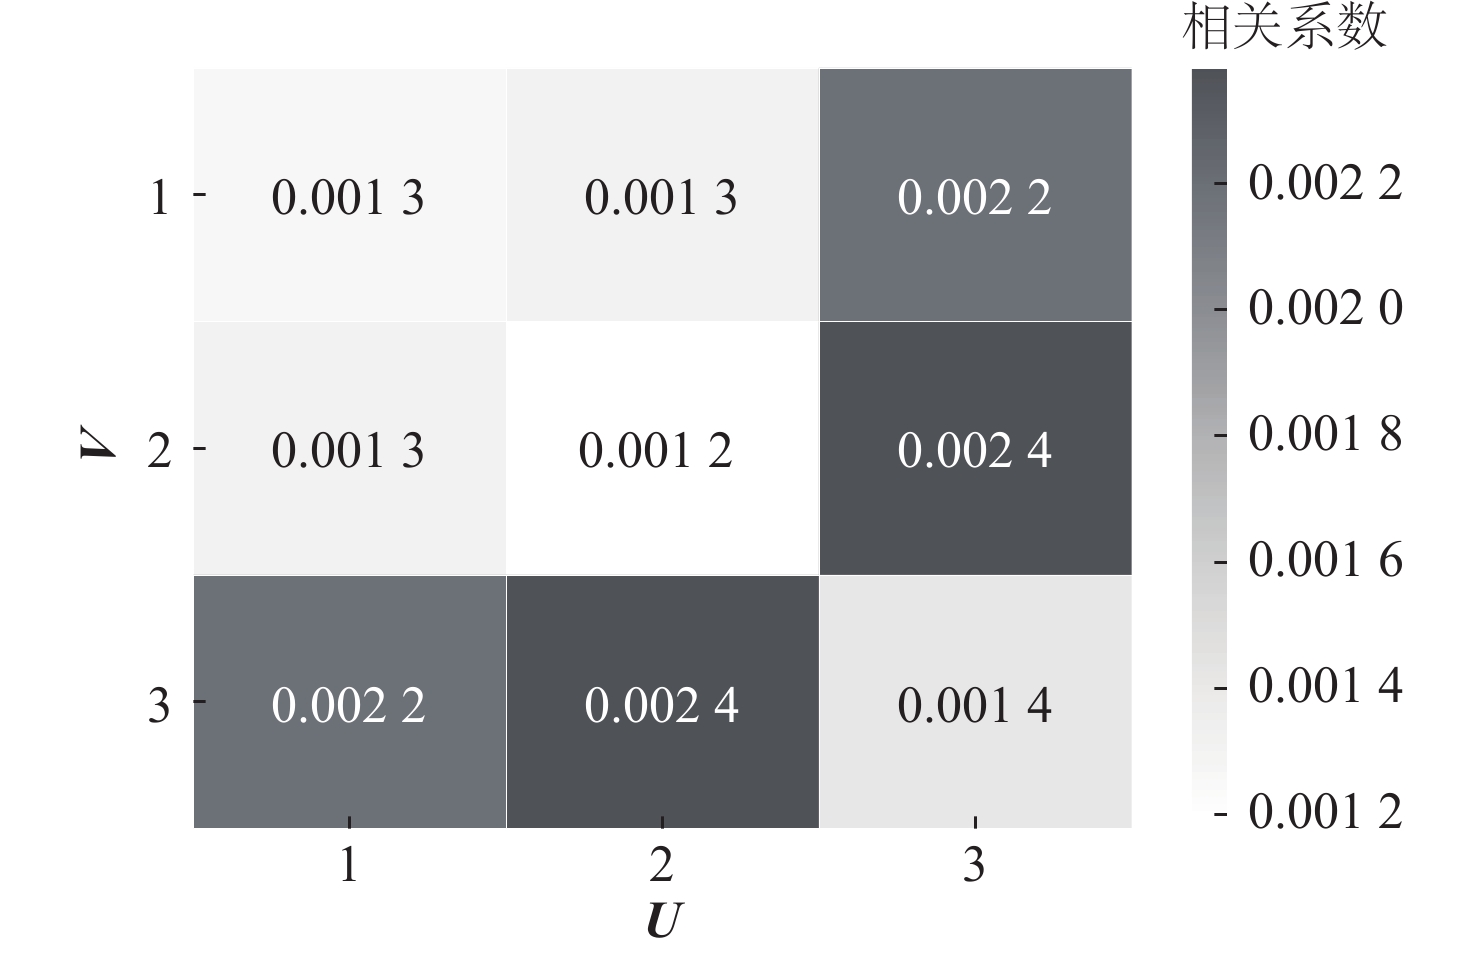
图 2 并行式分块增量算法得到的协方差矩阵的相对误差平均值
Figure 2. Average of relative error for estimation of cross-covariance matrix calculated by parallel block incremental method
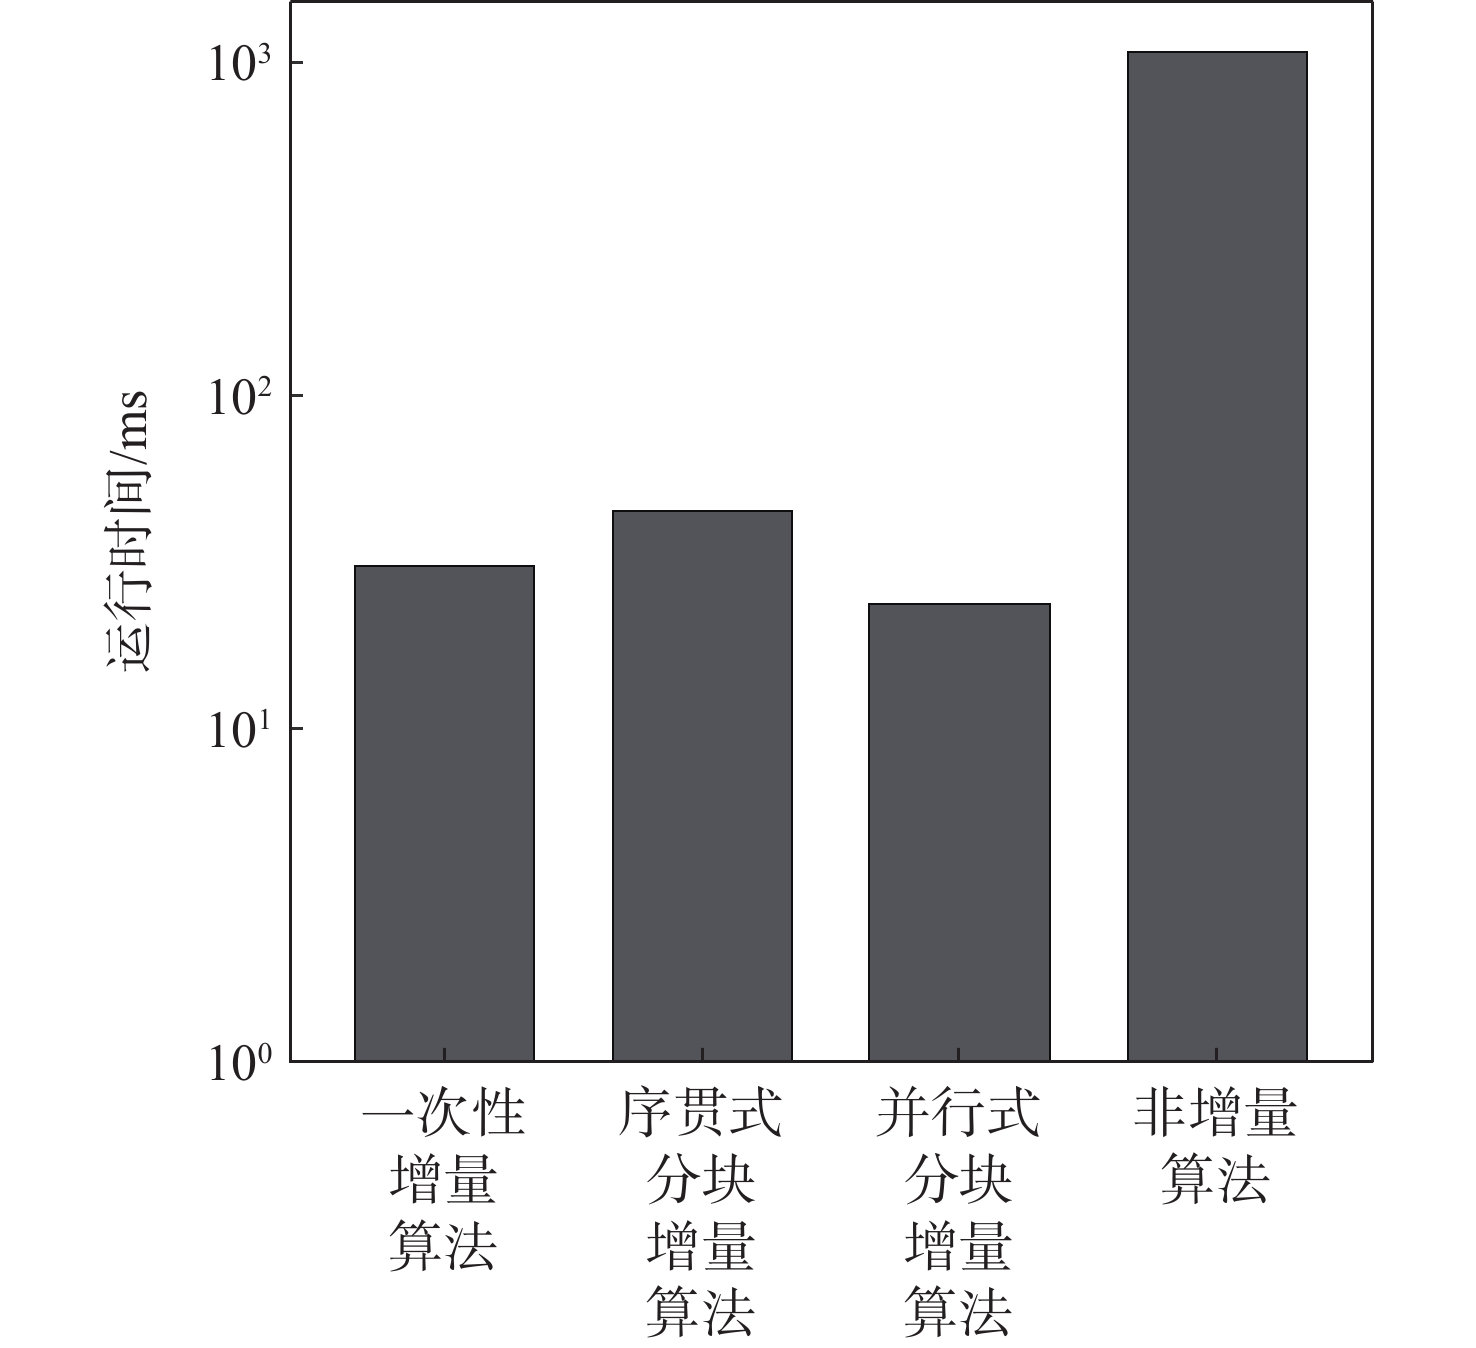
图 3 对微博假新闻数据进行典型相关分析的4种算法运行时间对比
Figure 3. Comparison of running time of CCA with four different incremental methods of fake news data from Weibo
表 1 增量算法的运行时间
Table 1. Running time of incremental methods
s D n θ 一次性增量算法 序贯式分块增量算法 并行式分块增量算法 非增量算法 4 10 000 0.01 0.0017(2.91×10⁻⁷) 0.0024(2.71×10⁻⁷) 0.0030(1.79×10⁻⁷) 0.3095(1.60×10⁻⁴) 100 000 0.01 0.0135(1.32×10⁻⁶) 0.0180(3.31×10⁻⁶) 0.0101(3.37×10⁻⁷) 3.1154(9.69×10⁻³) 0.1 0.1307(3.16×10⁻⁵) 0.1741(1.21×10⁻⁴) 0.1014(2.14×10⁻⁵) 3.3075(5.98×10⁻³) 200 000 0.1 0.2688(2.06×10⁻³) 0.3496(4.08×10⁻⁴) 0.1936(4.36×10⁻⁵) 6.6716(1.84×10⁻²) 5 10 000 0.01 0.0025(2.65×10⁻⁷) 0.0041(2.22×10⁻⁷) 0.0037(1.34×10⁻⁷) 0.5534(4.35×10⁻⁴) 100 000 0.01 0.0239(1.59×10⁻⁵) 0.0329(5.41×10⁻⁴) 0.0187(5.89×10⁻⁷) 5.3998(2.71×10⁻²) 0.1 0.2204(1.17×10⁻⁴) 0.2970(2.88×10⁻⁴) 0.1685(2.27×10⁻⁵) 5.7539(1.56×10⁻²) 200 000 0.1 0.4430(5.27×10⁻⁴) 0.6009(1.52×10⁻³) 0.3363(2.31×10⁻⁴) 11.6523(5.86×10⁻¹) 6 10 000 0.01 0.0037(1.05×10⁻⁶) 0.0060(3.95×10⁻⁷) 0.0052(1.69×10⁻⁷) 0.8399(9.31×10⁻⁴) 100 000 0.01 0.0334(5.38×10⁻⁶) 0.0458(2.08×10⁻⁵) 0.0285(2.47×10⁻⁶) 8.3388(6.95×10⁻²) 0.1 0.3341(4.51×10⁻⁴) 0.4469(5.04×10⁻⁴) 0.2588(8.46×10⁻⁵) 8.9295(4.47×10⁻²) 200 000 0.1 0.6664(8.13×10⁻⁴) 0.9018(2.18×10⁻³) 0.5164(3.06×10⁻⁴) 17.8481(2.16×10⁻¹)  下载: 导出CSV
表 2 微博假新闻中不同情感色彩与主题之间的典型主轴及典型相关系数
Table 2. Canonical variables and canonical correlations between different emotions and topics in fake news of Weibo
h ρh 1 0.4519 2 0.2459 3 0.1319
下载: 导出CSV
-
[1] 卢珊, 王惠文. 成分数据因变量的混合数据回归及在股市情绪构成分析中的应用[J]. 计量经济学报, 2021, 1(2): 469-478.LU S, WANG H W. Mixed data regression with compositional response and an application in shock market sentiment analysis[J]. China Journal of Econometrics, 2021, 1(2): 469-478(in Chinese). [2] WANG H W, LU S, ZHAO J C. Aggregating multiple types of complex data in stock market prediction: A model-independent framework[J]. Knowledge-based Systems, 2019, 164: 193-204. doi: 10.1016/j.knosys.2018.10.035 [3] WEI Y G, WANG Z C, WANG H W, et al. Compositional data techniques for forecasting dynamic change in China’s energy consumption structure by 2020 and 2030[J]. Journal of Cleaner Production, 2021, 284: 124702. doi: 10.1016/j.jclepro.2020.124702 [4] ZUZOLO D, CICCHELLA D, LIMA A, et al. Potentially toxic elements in soils of Campania region (Southern Italy): Combining raw and compositional data[J]. Journal of Geochemical Exploration, 2020, 213: 106524. doi: 10.1016/j.gexplo.2020.106524 [5] EBRAHIMI P, ALBANESE S, ESPOSITO L, et al. Coupling compositional data analysis (CoDA) with hierarchical cluster analysis (HCA) for preliminary understanding of the dynamics of a complex water distribution system: The Naples (South Italy) case study[J]. Environmental Science:Water Research & Technology, 2021, 7(6): 1060-1077. [6] JANSSEN I, CLARKE A E, CARSON V, et al. A systematic review of compositional data analysis studies examining associations between sleep, sedentary behaviour, and physical activity with health outcomes in adults[J]. Applied Physiology Nutrition and Metabolism, 2020, 45(10): S248-S257. [7] AITCHISON J. Principal component analysis of compositional data[J]. Biometrika, 1983, 70(1): 57-65. doi: 10.1093/biomet/70.1.57 [8] WANG H W, SHANGGUAN L Y, GUAN R, et al. Principal component analysis for compositional data vectors[J]. Computational Statistics, 2015, 30(4): 1079-1096. doi: 10.1007/s00180-015-0570-1 [9] AITCHISON J. The statistical analysis of compositional data[J]. Journal of the Royal Statistical Society: Series B (Methodological), 1982, 44(2): 139-160. doi: 10.1111/j.2517-6161.1982.tb01195.x [10] WANG H W, SHANGGUAN L Y, WU J J, et al. Multiple linear regression modeling for compositional data[J]. Neurocomputing, 2013, 122: 490-500. [11] 龙文, 王惠文. 成分数据偏最小二乘 Logistic 回归模型及其应用[J]. 数量经济技术经济研究, 2006, 23(9): 156-161.LONG W, WANG H W. PLS Logistic regressionon compositional data and its application[J]. The Journal of Quantitative & Technical Economics, 2006, 23(9): 156-161(in Chinese). [12] WANG H W, WANG Z C, WANG S S. Sliced inverse regression method for multivariate compositional data modeling[J]. Statistical Papers, 2021, 62(1): 361-393. doi: 10.1007/s00362-019-01093-z [13] TANG Z Z, CHEN G H. Zero-inflated generalized Dirichlet multinomial regression model for microbiome compositional data analysis[J]. Biostatistics, 2019, 20(4): 698-713. doi: 10.1093/biostatistics/kxy025 [14] 夏棒, 王惠文, 周荣刚. 成分数据路径分析模型[J]. 数学的实践与认识, 2019, 49(14): 191-199.XIA B, WANG H W, ZHOU R G. Path modeling for compositional data[J]. Mathematics in Practice and Theory, 2019, 49(14): 191-199(in Chinese). [15] WANG Z C, WANG H W, WANG S S. Linear mixed-effects model for multivariate longitudinal compositional data[J]. Neurocomputing, 2019, 335: 48-58. doi: 10.1016/j.neucom.2019.01.043 [16] GREENACRE M. Variable selection in compositional data analysis using pairwise logratios[J]. Mathematical Geosciences, 2019, 51(5): 649-682. doi: 10.1007/s11004-018-9754-x [17] HARDOON D R, SZEDMAK S, SHAWE-TAYLOR J. Canonical correlation analysis: An overview with application to learning methods[J]. Neural Computation, 2004, 16(12): 2639-2664. doi: 10.1162/0899766042321814 [18] HOTELLING H. Relations between two sets of variates[J]. Biometrika, 1936, 28(3-4): 321-377. [19] 龙文. 带约束条件的数据表分析预测方法及应用研究[D]. 北京: 北京航空航天大学, 2007: 14-20.LONG W. Method study based on constrained data and application [D]. Beijing: Beihang University, 2007: 14-20(in Chinese). [20] ARTAC M, JOGAN M, LEONARDIS A. Incremental PCA for on-line visual learning and recognition[C]//Proceedings of the 2002 International Conference on Pattern Recognition. Piscataway: IEEE Press, 2002: 781-784. [21] LI Y M. On incremental and robust subspace learning[J]. Pattern Recognition, 2004, 37(7): 1509-1518. doi: 10.1016/j.patcog.2003.11.010 [22] ZENG X, LI G Z. Incremental partial least squares analysis of big streaming data[J]. Pattern Recognition, 2014, 47(11): 3726-3735. doi: 10.1016/j.patcog.2014.05.022 [23] WEI Y, WANG H G, WANG S S, et al. Incremental modelling for compositional data streams[J]. Communications in Statistics-Simulation and Computation, 2019, 48(8): 2229-2243. doi: 10.1080/03610918.2018.1455870 [24] EGOZCUE J J, PAWLOWSKY-GLAHN V, MATEU-FIGUERAS G, et al. Isometric logratio transformations for compositional data analysis[J]. Mathematical Geology, 2003, 35(3): 279-300. doi: 10.1023/A:1023818214614 [25] AITCHISON J, EGOZCUE J J. Compositional data analysis: Where are we and where should we be heading?[J]. Mathematical Geology, 2005, 37(7): 829-850. doi: 10.1007/s11004-005-7383-7 [26] AITCHISON J. The statistical analysis of compositional data[M]. London: Chapman and Hall, 1986. [27] MEEL P, VISHWAKARMA D K. Fake news, rumor, information pollution in social media and web: A contemporary survey of state-of-the-arts, challenges and opportunities[J]. Expert Systems with Applications, 2020, 153(1): 112986. [28] LU S, ZHAO J C, WANG H W. MD-MBPLS: A novel explanatory model in computational social science[J]. Knowledge-based Systems, 2021, 223: 107023. [29] CHUAI Y W, ZHAO J C. Anger makes fake news viral online[EB/OL]. (2020-08-27) [2021-12-01]. -

 下载:
下载:

 点击查看大图
计量
- 文章访问数: 278
- HTML全文浏览量: 55
- PDF下载量: 25
- 被引次数: 0
