


-
摘要:
作为智能交通系统的核心技术,稳健的交通流量预测是一个长期存在但具有挑战的任务。不论是工业界还是学术界,现有模型需要大量训练数据、易受数据噪声影响而表现不稳健,是限制该领域发展与实际应用落地的重要因素。而在学术界,图对比学习可以通过数据增强与对比损失来降低数据需求量,同时提升模型抵抗数据噪声的能力。提出一种交通流量图对比学习(TFGCL)框架,用于稳健的交通流量预测。TFGCL框架有3个创新点:针对交通流量图(TFG)数据的独特时空特性,TFGCL框架从时间和空间2个角度出发,提出3种TFG数据增强方法。针对TFG数据中语义相似的假负样本,提出一个过滤策略使TFGCL框架能够免受其干扰,从而学习到高质量的表征。TFGCL框架通过联合交通流量预测任务和图对比学习任务进行同时训练。在3个真实交通数据集上与8个基线模型进行对比实验,结果表明:TFGCL框架的预测性能更为稳健,较最优基线模型最高提升6.24%,TFGCL框架的稳健性尤其体现在数据缺失较为明显的数据集和长时交通流量预测任务中。
Abstract:Robust traffic flow prediction, as the core technology of Intelligent Transportation Systems, is a long-standing but challenging task. The fact that current models need a lot of training data and are susceptible to noise disturbance is a major factor that is restricting the growth of this subject. In academia, graph contrastive learning can alleviate the data-demanding issue and improve the model’s ability to resist data noise through data augmentation and contrastive learning. Therefore, this paper proposes a Traffic Flow prediction framework that incorporates graph contrast learning (TFGCL) for robust traffic flow prediction. The framework has three contributions: First of all, given the unique spatio-temporal characteristics of traffic flow graph (TFG) data, TFGCL proposes three TFG data augmentation methods from the perspective of time and space. Secondly, in order to learn high-quality representations, this work also suggests a filtering method to shield the model from harsh negative samples with identical semantics. Finally, TFGCL jointly trains the traffic flow prediction task and the graph contrastive learning task. Extensive experiments with 8 baselines on 3 real traffic datasets show that the prediction performance of the TFGCL framework is more robust (an improvement of 6.24% compared to the best baseline), especially in datasets with obvious data missing and long-term traffic flow forecasting tasks.
-

图 4 模型性能在不同数据集的平均排序对比
Figure 4. Comparison of model performances of average ranking on different datasets
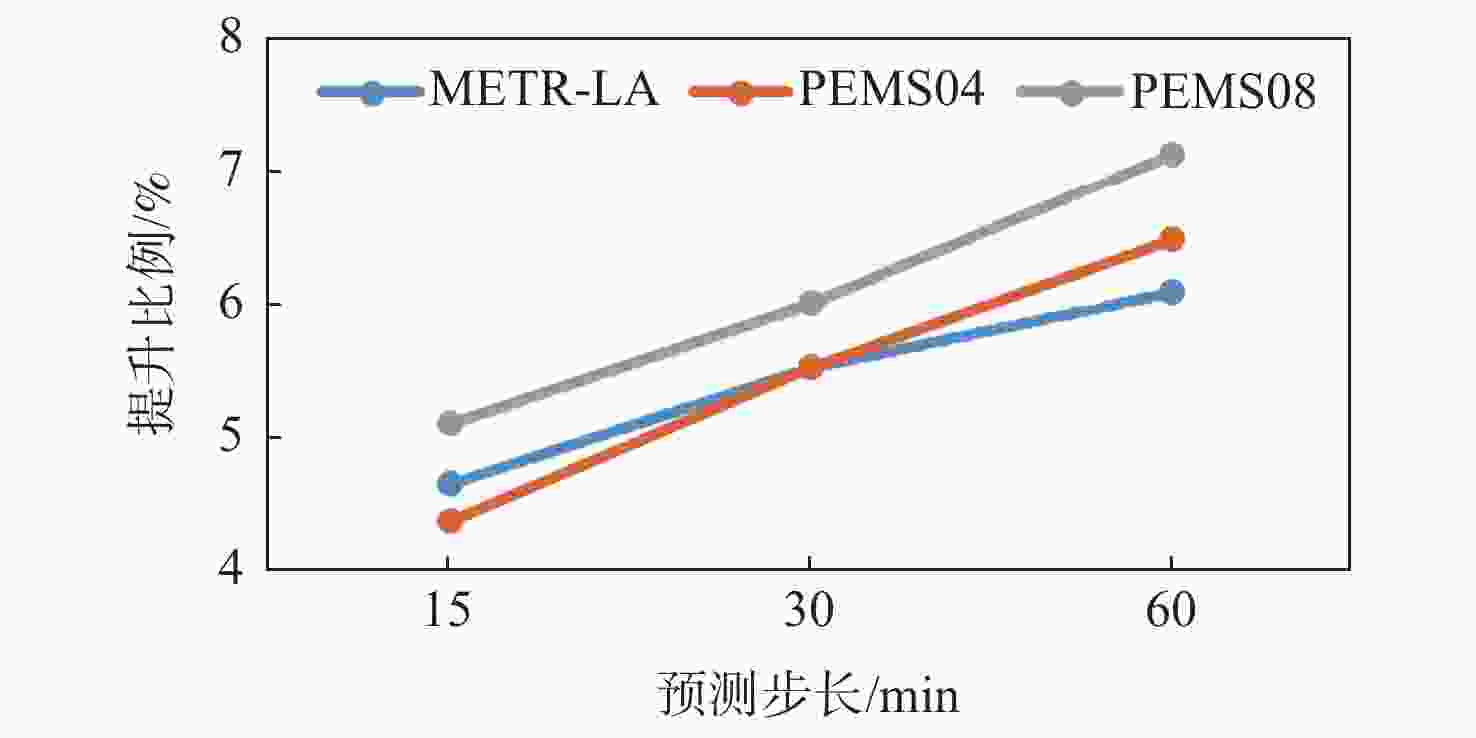
图 5 TFGCL框架在不同预测步长下较最优基线模型的提升
Figure 5. Improvement of TFGCL compared to optimal baseline model on different prediction horizon

图 6 不同模型在PEMS08数据集上的稳健性比较
Figure 6. Robustness comparison of different models on PEMS08 dataset
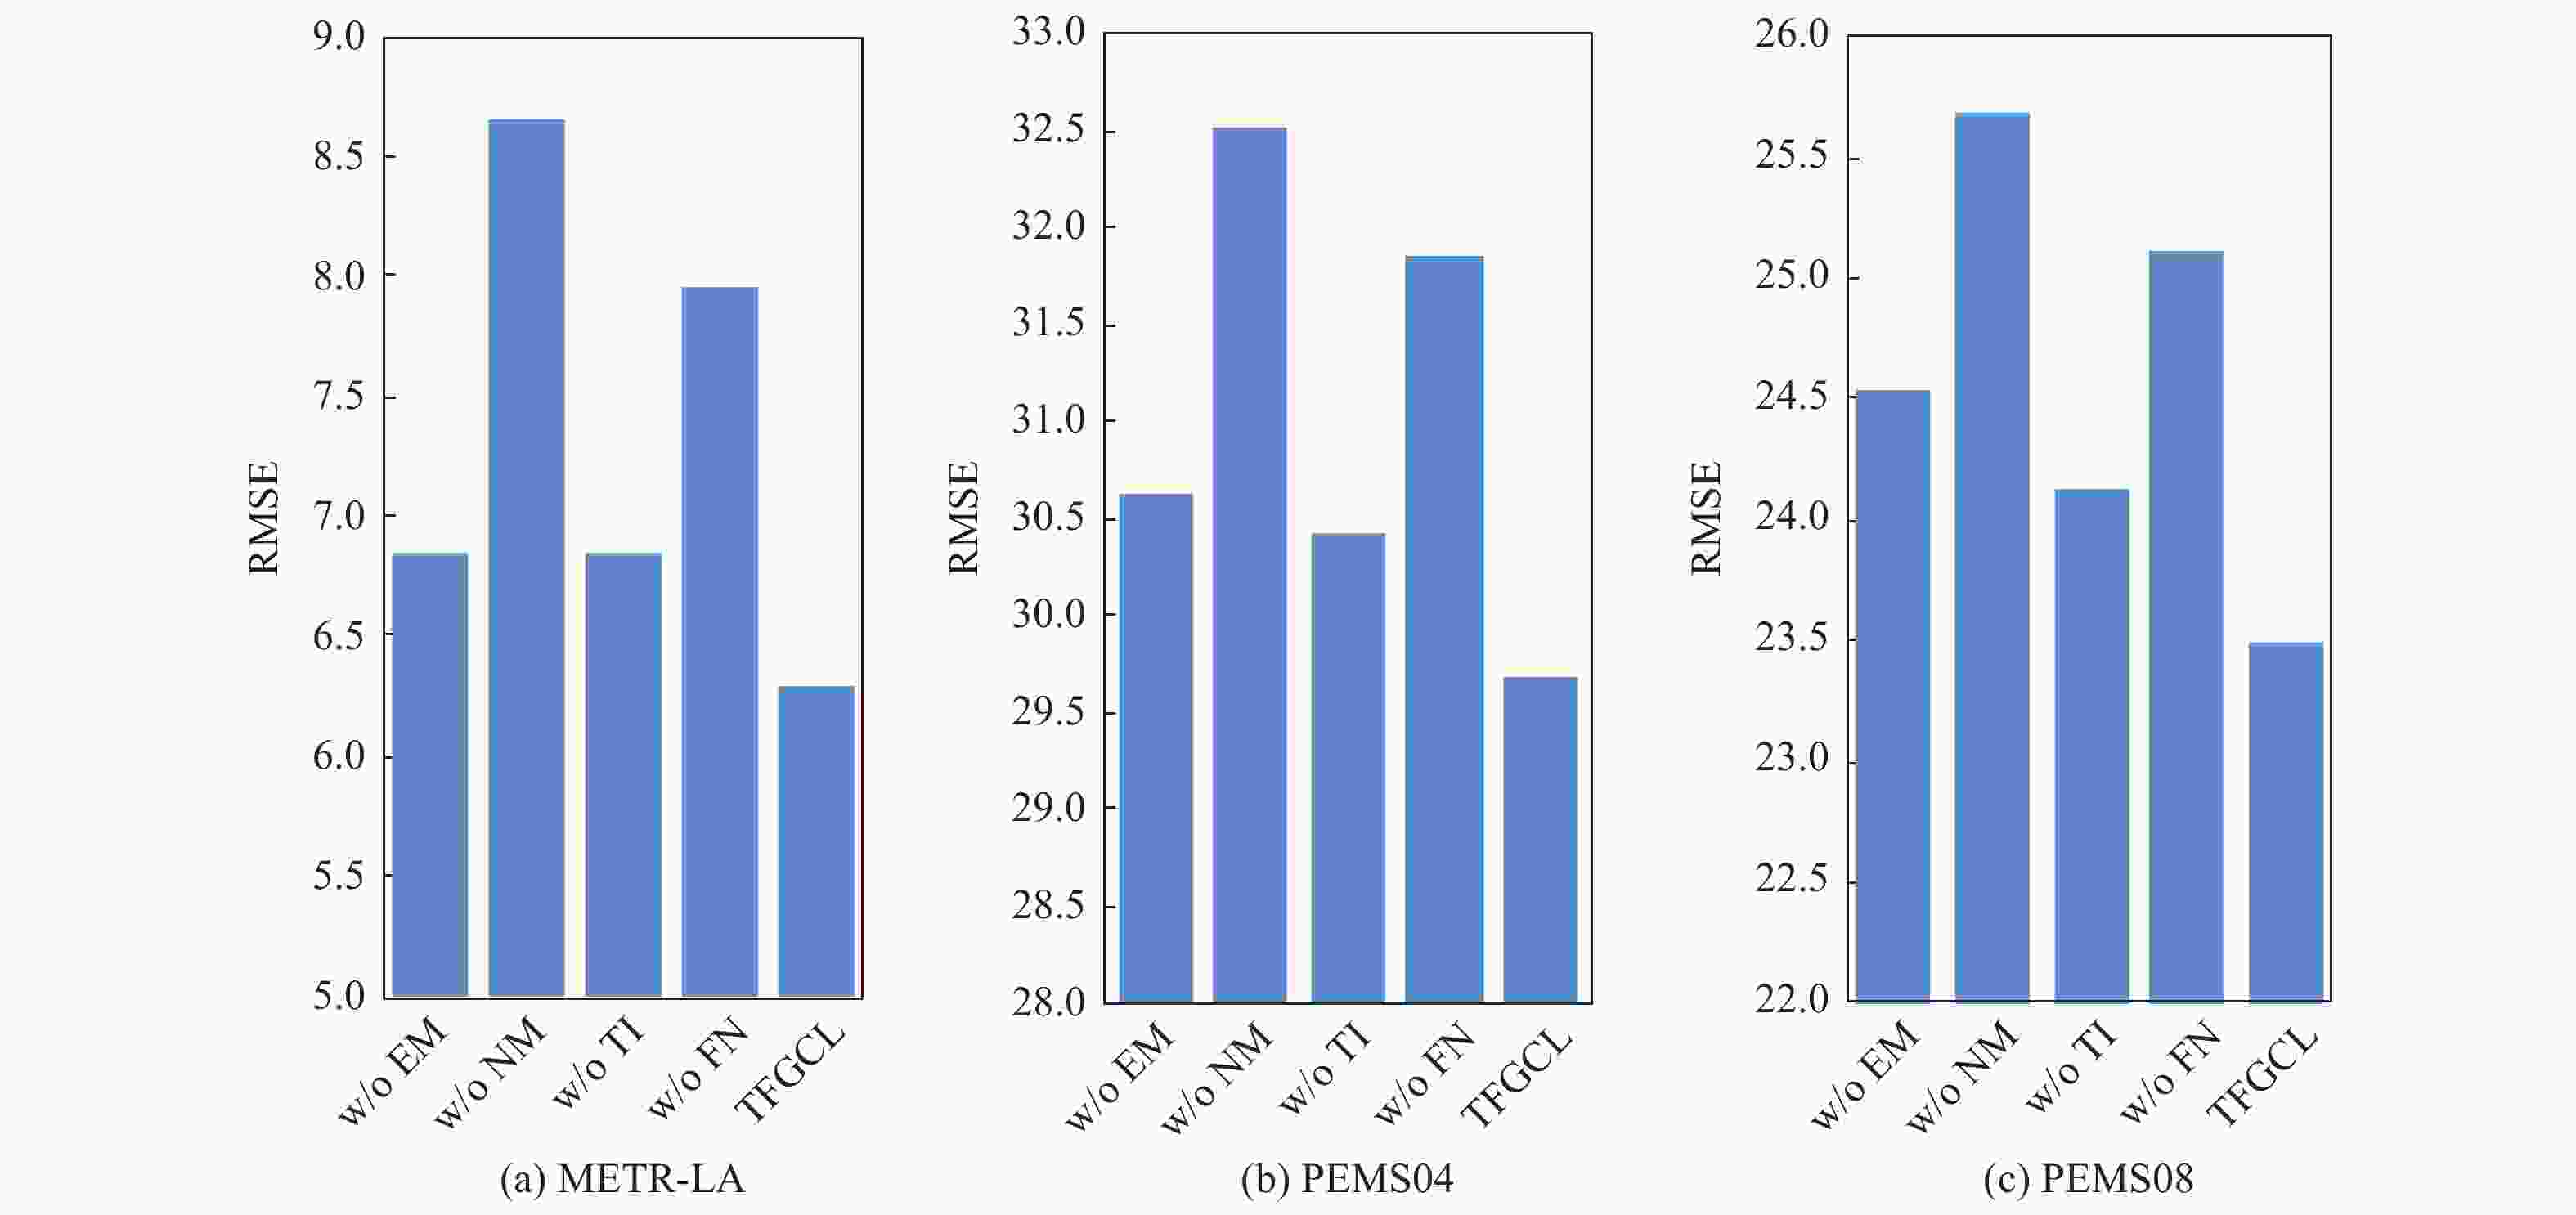
图 7 不同数据增强方法与策略的消融实验
Figure 7. Ablation study on different data augmentation methods and strategies
表 1 数据统计信息
Table 1. Statistical information on data
数据集 节点个数 边个数 时间步个数 数据缺失率/% METR-LA 207 1 515 34 272 8.11 PEMS04 307 340 16 992 3.18 PEMS08 170 295 17 856 0.70  下载: 导出CSV
表 2 不同模型在数据集METR-LA、PEMS04和PEMS08上的性能比较
Table 2. Performance comparison of different models on the METR-LA, PEMS04 and PEMS08 datasets
数据集 模型 MAE MAPE RMSE 15 min 30 min 60 min 15 min 30 min 60 min 15 min 30 min 60 min HA 4.145 4.145 4.145 0.129 0.129 0.129 7.772 7.772 7.772 ARIMA 3.853 4.925 6.915 0.093 0.137 0.174 6.475 9.608 14.539 GRU 3.879 3.971 4.101 0.109 0.113 0.120 7.468 7.746 8.231 DCRNN 2.709 3.125 3.599 0.070 0.085 0.105 5.254 6.386 7.620 METR-LA STGCN 2.793 3.167 3.540 0.073 0.087 0.102 5.455 6.514 7.525 GWNet 2.804 3.206 3.587 0.074 0.091 0.108 5.491 6.530 7.421 AGCRN 2.836 3.209 3.574 0.075 0.089 0.102 5.507 6.535 7.424 MTGNN 2.660 3.038 3.467 0.069 0.083 0.099 5.114 6.132 7.217 TFGCL框架 2.517 2.827 3.245 0.066 0.079 0.093 4.875 5.806 6.763 HA 24.520 24.520 24.520 0.167 0.167 0.167 39.838 39.838 39.838 ARIMA 21.822 24.681 28.869 0.146 0.170 0.221 35.521 41.218 53.266 GRU 22.441 22.506 22.583 0.155 0.156 0.157 36.286 36.342 36.447 DCRNN 19.581 21.467 24.864 0.133 0.147 0.175 31.125 34.067 39.228 PEMS04 STGCN 19.149 20.133 21.567 0.133 0.140 0.150 30.301 31.886 34.200 GWNet 17.692 18.574 19.956 0.125 0.131 0.149 28.516 29.888 31.848 AGCRN 18.132 18.834 19.851 0.124 0.130 0.139 29.221 30.464 31.965 MTGNN 17.929 18.760 20.135 0.133 0.140 0.150 28.837 30.296 32.510 TFGCL框架 17.377 18.093 19.290 0.122 0.127 0.135 28.271 29.080 30.668 HA 21.193 21.193 21.193 0.138 0.138 0.138 36.644 36.644 36.644 ARIMA 20.992 24.998 28.953 0.140 0.168 0.179 36.570 39.545 48.436 GRU 19.992 20.126 20.461 0.124 0.125 0.127 32.276 32.569 33.200 DCRNN 15.139 16.619 19.345 0.098 0.107 0.125 23.476 25.982 30.058 PEMS08 STGCN 15.166 16.188 17.819 0.100 0.106 0.116 23.615 25.401 27.818 GWNet 13.486 14.349 15.672 0.091 0.093 0.108 21.615 23.375 25.855 AGCRN 14.146 14.962 16.427 0.092 0.097 0.121 22.241 24.055 26.557 MTGNN 14.001 14.883 16.583 0.097 0.101 0.116 21.968 23.624 26.128 TFGCL框架 13.277 14.057 15.221 0.090 0.091 0.105 21.280 22.900 25.112 注:其中最优结果用粗体表示,次优结果用下划线表示。
下载: 导出CSV
表 3 TFGCL框架较最优基线模型的提升
Table 3. The improvement of TFGCL compared to optimal baselines model
数据集 MAE MAPE RMSE 平均得分 METR-LA 6.24 4.54 5.42 5.40 PEMS04 2.57 2.03 2.42 2.34 PEMS08 2.15 2.12 2.15 2.14
下载: 导出CSV
表 4 不同模型的运行效率比较
Table 4. Operational efficiency comparison of different models
s 模型 train eval METR_LA PEMS04 PEMS08 METR_LA PEMS04 PEMS08 DCRNN 382.9 274.9 262.3 28.6 21.2 19.2 STGCN 40.3 8.7 20.3 4.7 3.8 2 GWNet 33.7 25.4 15 1.2 1 0.5 AGCRN 37.4 25 18.6 2.1 1.4 1 MTGNN 34 24.4 15.7 1.5 1.2 0.7 TFGCL框架 24.2 17.4 11.6 0.8 0.6 0.4
下载: 导出CSV
-
[1] LI Y G, YU R, SHAHABI C, et al. Diffusion convolutional recurrent neural network: Data-driven traffic forecasting[EB/OL]. (2018-02-22)[2021-12-20]. https://arxiv.org/abs/1707.01926.pdf. [2] BAI L, YAO L N, LI C, et al. Adaptive graph convolutional recurrent network for traffic forecasting[C]//Proceedings of the 34th International Conference on Neural Information Processing Systems. New York: ACM, 2020: 17804-17815. [3] WU Z H, PAN S R, LONG G D, et al. Graph wavenet for deep spatial-temporal graph modeling[C]//Proceedings of the 28th International Joint Conference on Artificial Intelligence. New York: ACM, 2019: 1907-1913. [4] TANG X F, YAO H X, SUN Y W, et al. Joint modeling of local and global temporal dynamics for multivariate time series forecasting with missing values[J]. Proceedings of the AAAI Conference on Artificial Intelligence, 2020, 34(4): 5956-5963. doi: 10.1609/aaai.v34i04.6056 [5] 李佩钰. 一种基于小波和神经网络的短时交通流量预测[J]. 计算机技术与发展, 2020, 30(1): 135-139. doi: 10.3969/j.issn.1673-629X.2020.01.024Li P Y. Short-term traffic flow prediction based on wavelet and neural network[J]. Computer Technology and Development, 2020, 30(1): 135-139(in Chinese). doi: 10.3969/j.issn.1673-629X.2020.01.024 [6] TIAN C Y, CHAN W K V. Spatial-temporal attention wavenet: A deep learning framework for traffic prediction considering spatial-temporal dependencies[J]. IET Intelligent Transport Systems, 2021, 15(4): 549-561. doi: 10.1049/itr2.12044 [7] 冯宁, 郭晟楠, 宋超, 等. 面向交通流量预测的多组件时空图卷积网络[J]. 软件学报, 2019, 30(3): 759-769. doi: 10.13328/j.cnki.jos.005697FENG N, GUO S N, SONG C, et al. Multi-component spatial-temporal graph convolution networks for traffic flow forecasting[J]. Journal of Software, 2019, 30(3): 759-769(in Chinese). doi: 10.13328/j.cnki.jos.005697 [8] YOU Y N, CHEN T L, SUI Y D, et al. Graph contrastive learning with augmentations[EB/OL]. (2021-04-03)[2021-12-21]. https://arxiv.org/abs/2010.13902.pdf. [9] XU D K, CHENG W, LUO D S, et al. InfoGCL: Information-aware graph contrastive learning[EB/OL]. (2021-10-28)[2021-12-23]. https://arxiv.org/abs/2110.15438.pdf. [10] ZHU Y Q, XU Y C, YU F, et al. Graph contrastive learning with adaptive augmentation[C]// Proceedings of the Web Conference 2021. New York: ACM, 2021: 2069-2080. [11] CHEN T, KORNBLITH S, NOROUZI M, et al. A simple framework for contrastive learning of visual representations[C]// Proceedings of the 37th International Conference on Machine Learning. New York: ACM, 2020: 1597-1607. [12] ZHANG J B, ZHENG Y, QI D K. Deep spatio-temporal residual networks for citywide crowd flows prediction[C]// Proceedings of the Thirty-First AAAI Conference on Artificial Intelligence. New York: ACM, 2017: 1655-1661. [13] DAGANZO C F, LAVAL J A. Moving bottlenecks: A numerical method that converges in flows[J]. Transportation Research Part B:Methodological, 2005, 39(9): 855-863. doi: 10.1016/j.trb.2004.10.004 [14] 田钧方, 朱陈强, 贾宁, 等. 基于轨迹数据的车辆跟驰行为分析与建模综述[J]. 交通运输系统工程与信息, 2021, 21(5): 148-159. doi: 10.16097/j.cnki.1009-6744.2021.05.014TIAN J F, ZHU C Q, JIA N, et al. Review of car-following behavior analysis and modeling based on trajectory data[J]. Journal of Transportation Systems Engineering and Information Technology, 2021, 21(5): 148-159 (in Chinese). doi: 10.16097/j.cnki.1009-6744.2021.05.014 [15] SAEED N, LARSEN O I. Application of queuing methodology to analyze congestion: A case study of the Manila International Container Terminal, Philippines[J]. Case Studies on Transport Policy, 2016, 4(2): 143-149. doi: 10.1016/j.cstp.2016.02.001 [16] MO Z B, SHI R Y, DI X A. A physics-informed deep learning paradigm for car-following models[J]. Transportation Research Part C:Emerging Technologies, 2021, 130: 103240. doi: 10.1016/j.trc.2021.103240 [17] JORG B, HAMILTON J D. Time series analysis[J]. Contemporary Sociology, 1995. [18] ZHAO L, SONG Y J, ZHANG C, et al. T-GCN: A temporal graph convolutional network for traffic prediction[J]. IEEE Transactions on Intelligent Transportation Systems, 2020, 21(9): 3848-3858. doi: 10.1109/TITS.2019.2935152 [19] CUI Z Y, HENRICKSON K, KE R M, et al. Traffic graph convolutional recurrent neural network: A deep learning framework for network-scale traffic learning and forecasting[J]. IEEE Transactions on Intelligent Transportation Systems, 2020, 21(11): 4883-4894. doi: 10.1109/TITS.2019.2950416 [20] YU B, YIN H T, ZHU Z X. Spatio-temporal graph convolutional networks: a deep learning framework for traffic forecasting[C]// Proceedings of the Twenty-Seventh International Joint Conference on Artificial Intelligence. California: International Joint Conferences on Artificial Intelligence Organization, 2018: 3634-3640. [21] GUO S N, LIN Y F, FENG N, et al. Attention based spatial-temporal graph convolutional networks for traffic flow forecasting[J]. Proceedings of the AAAI Conference on Artificial Intelligence, 2019, 33(1): 922-929. doi: 10.1609/aaai.v33i01.3301922 [22] WU Z H, PAN S R, LONG G D, et al. Connecting the dots: Multivariate time series forecasting with graph neural networks[C]// Proceedings of the 26th ACM SIGKDD International Conference on Knowledge Discovery & Data Mining. New York: ACM, 2020: 753-763. [23] YAO H X, TANG X F, WEI H A, et al. Revisiting spatial-temporal similarity: A deep learning framework for traffic prediction[J]. Proceedings of the AAAI Conference on Artificial Intelligence, 2019, 33(1): 5668-5675. doi: 10.1609/aaai.v33i01.33015668 [24] GUO K, HU Y L, SUN Y F, et al. Hierarchical graph convolution network for traffic forecasting[J]. Proceedings of the AAAI Conference on Artificial Intelligence, 2021, 35(1): 151-159. doi: 10.1609/aaai.v35i1.16088 [25] YI X, ZHENG Y, ZHANG J, et al. ST-MVL: Filling missing values in Geo-sensory time series data[C]//Proceedings of the Twenty-Fifth International Joint Conference on Artificial Intelligence. New York: AAAI Press, 2016: 2704-2710. [26] ZHANG H Y, CISSE M, DAUPHIN Y N, et al. Mixup: Beyond empirical risk minimization[EB/OL]. (2018-04-27)[2021-12-25]. https://arxiv.org/abs/1710.09412.pdf. [27] KIPF T N, WELLING M. Semi-supervised classification with graph convolutional networks[EB/OL]. (2017-02-22)[2021-12-26]. https://arxiv.org/abs/1609.02907.pdf. [28] VASWANI A, SHAZEER N, PARMAR N, et al. Attention is all you need[C]// Proceedings of the 31st International Conference on Neural Information Processing Systems. New York: ACM, 2017: 6000-6010. [29] SONG C, LIN Y F, GUO S N, et al. Spatial-temporal synchronous graph convolutional networks: A new framework for spatial-temporal network data forecasting[J]. Proceedings of the AAAI Conference on Artificial Intelligence, 2020, 34(1): 914-921. doi: 10.1609/aaai.v34i01.5438 [30] CHEN C, PETTY K, SKABARDONIS A, et al. Freeway performance measurement system: Mining loop detector data[J]. Transportation Research Record:Journal of the Transportation Research Board, 2001, 1748(1): 96-102. doi: 10.3141/1748-12 [31] SHUMAN D I, NARANG S K, FROSSARD P, et al. The emerging field of signal processing on graphs: Extending high-dimensional data analysis to networks and other irregular domains[J]. IEEE Signal Processing Magazine, 2013, 30(3): 83-98. doi: 10.1109/MSP.2012.2235192 -

 下载:
下载:


 点击查看大图
计量
- 文章访问数: 147
- HTML全文浏览量: 38
- PDF下载量: 18
- 被引次数: 0
