


Multi-shift interferometric phase filtering method based on convolutional neural network
-
摘要:
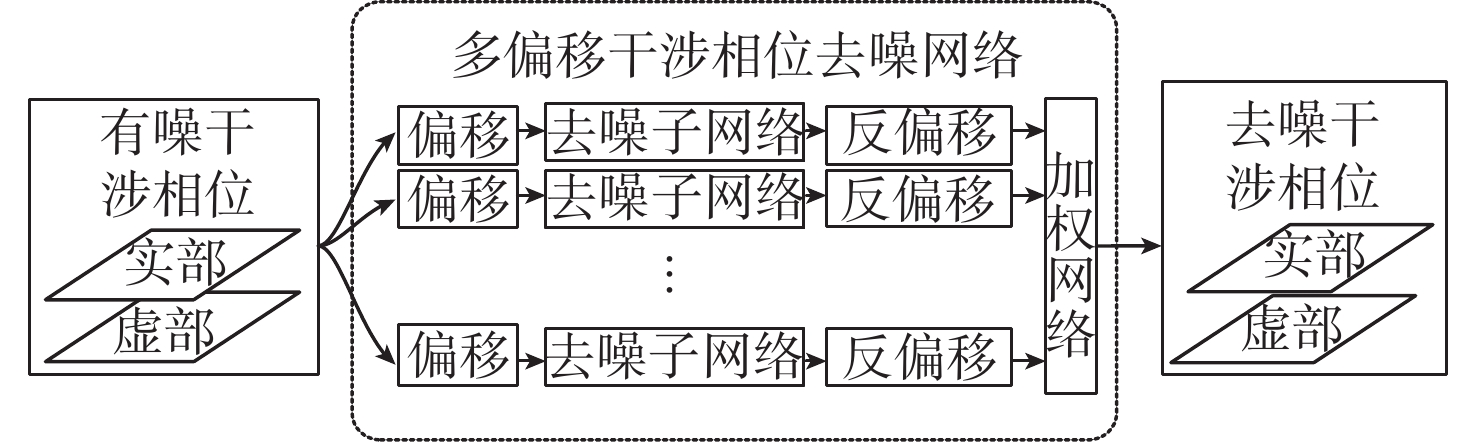
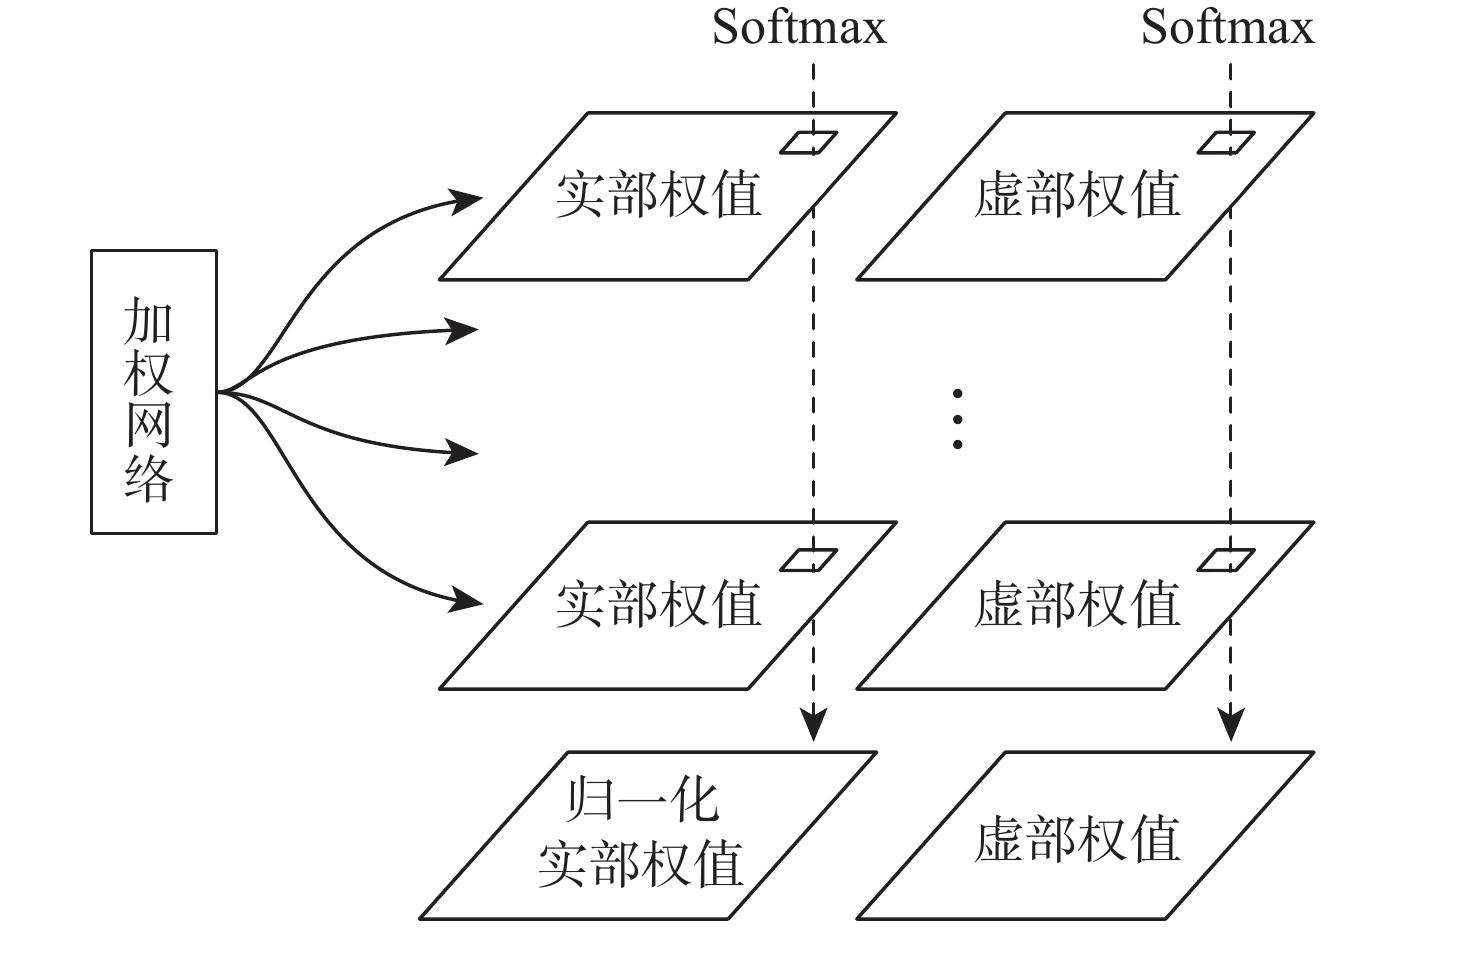
为提升干涉信号处理中相位滤波的效果,提出了一种基于卷积神经网络的多偏移干涉相位滤波方法。利用干涉相位噪声模型解释了相位偏移原理,并根据相位偏移原理构建多个卷积神经网络去噪器,利用其分别对不同偏移的干涉相位进行滤波,生成多个去噪相位。利用神经网络计算像素权值,对多个去噪结果进行融合,进而获得质量更好的相位滤波结果。仿真的数据和真实的数据试验表明,相较于传统方法,所提方法具有更好的细节保持能力,并且所得结果的均方根误差和留数点数量更低。
Abstract:To improve the performance of phase filtering in interferometric signal processing, a multi-shift interferometric phase filtering method based on convolutional neural networks is proposed. First, the phase shift principle is explained using the interferometric phase noise model. Then multiple convolutional neural network denoisers are built based on the phase shift principle and used to filter the interferometric phases with different shifts. Subsequently, a number of denoisers for convolutional neural networks are constructed using the notion of phase shift and employed to filter the interferometric phases with various shifts. Finally, multiple denoised phases are generated. The neural network is then used to calculate the pixel weights and fuse the multiple denoising results, resulting in a higher-quality result. The plenty denoising outputs are then fused and the pixel weights are calculated using the neural network to provide a higher-quality output. The simulated and real data experiments show that the proposed method retains more detail and has a lower root-mean-square error and the number of residues than the traditional methods. Experiments using both simulated and real data demonstrate that the suggested approach outperforms the conventional methods in terms of detail retention, root-mean-square error, and residue count.
-
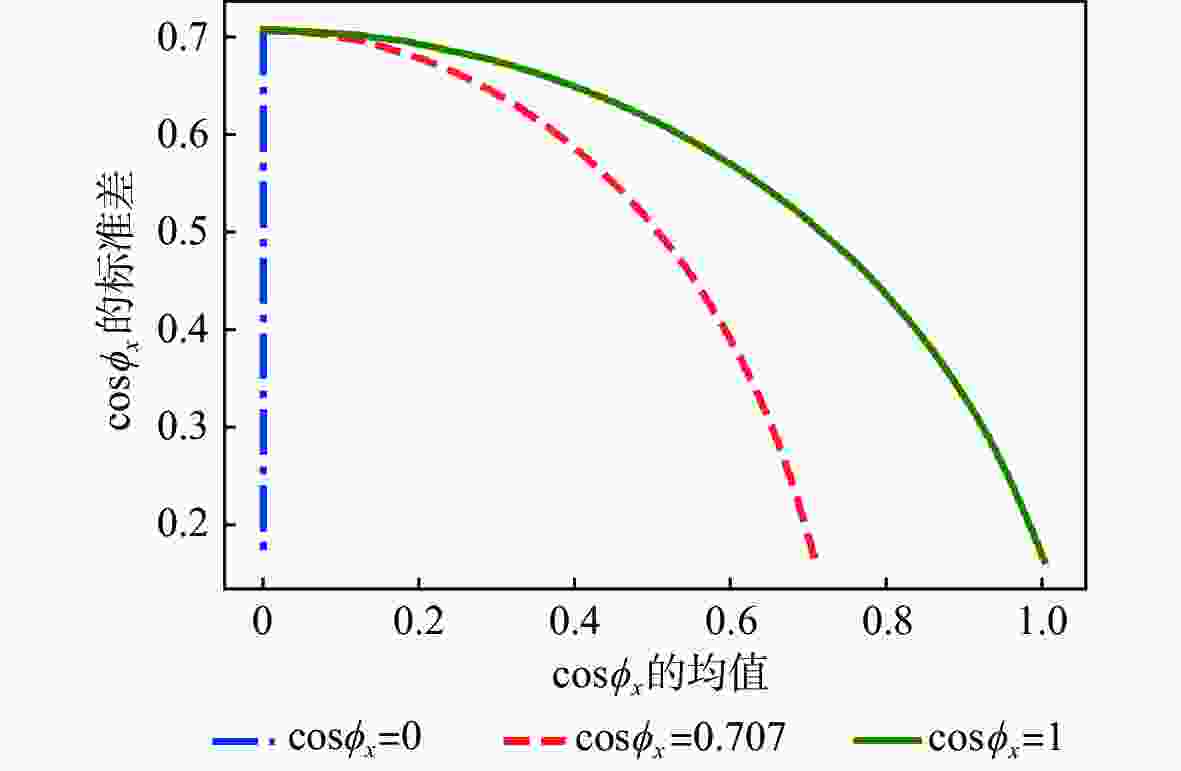
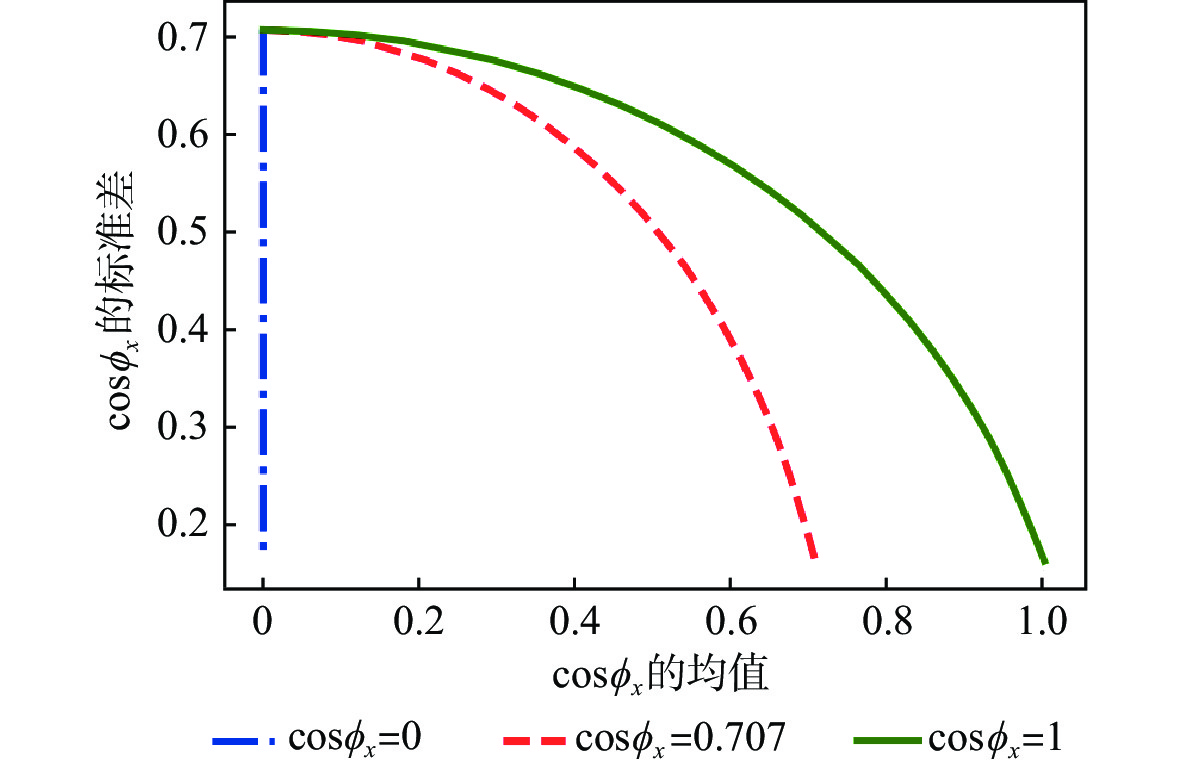
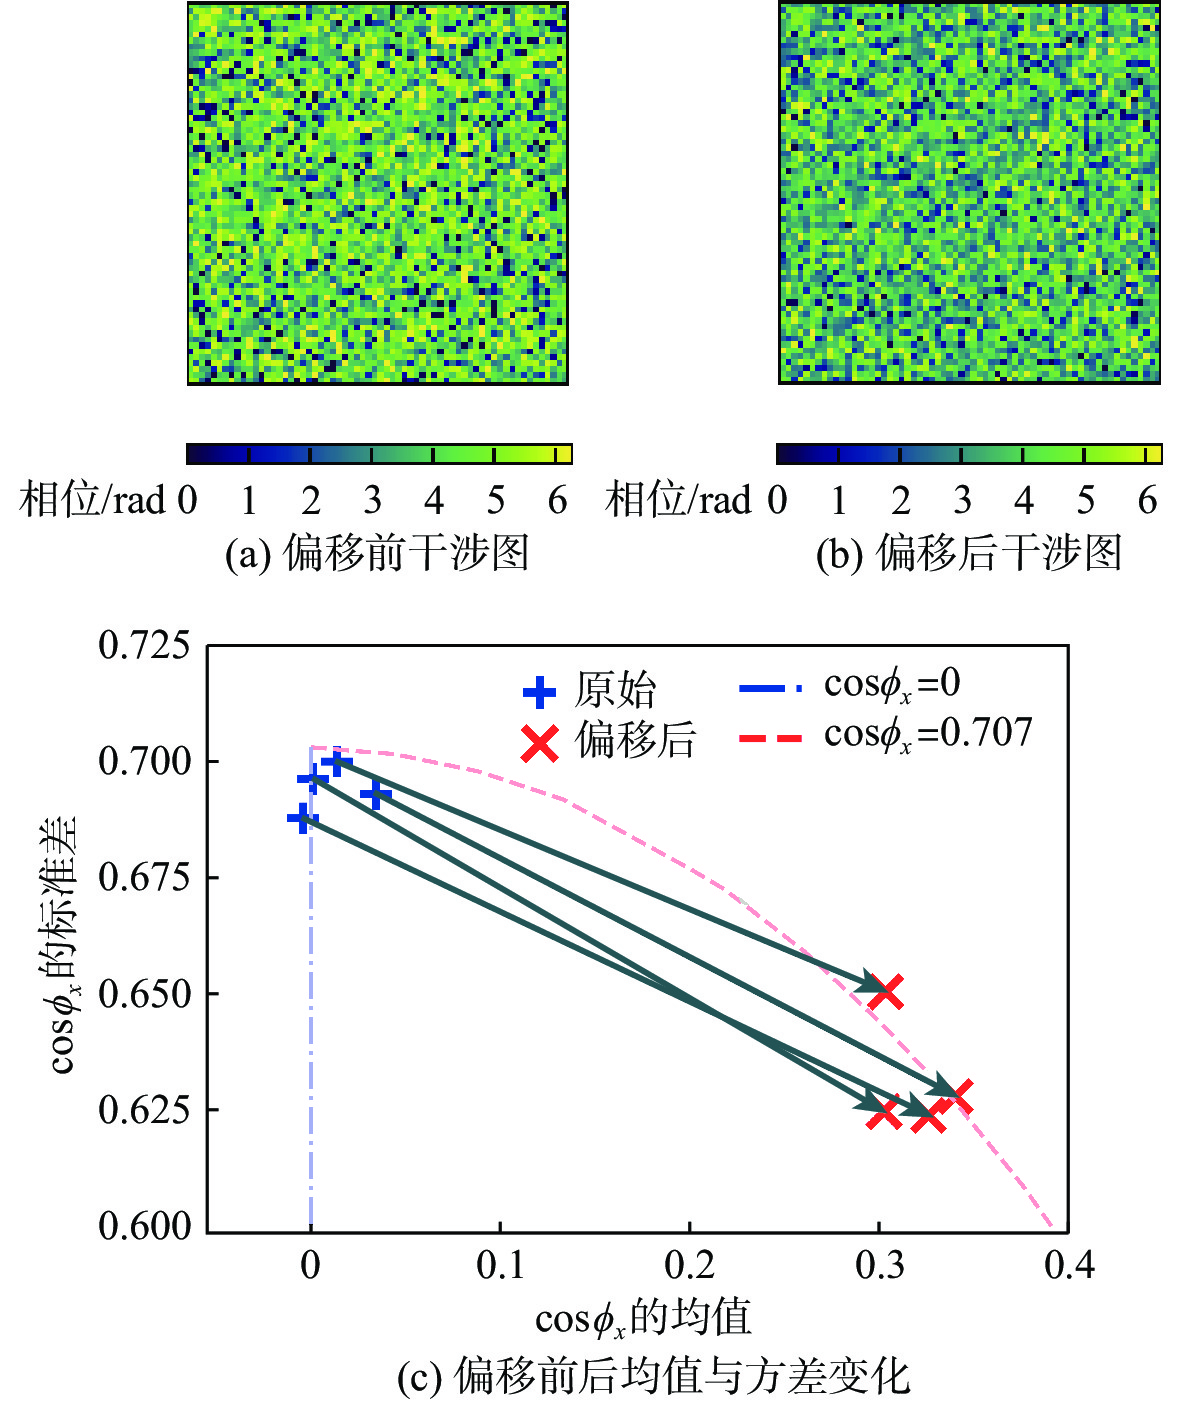
图 2 干涉相位实部期望与标准差关系
Figure 2. Expectation versus standard deviation curve for the real part of the interferometric phase
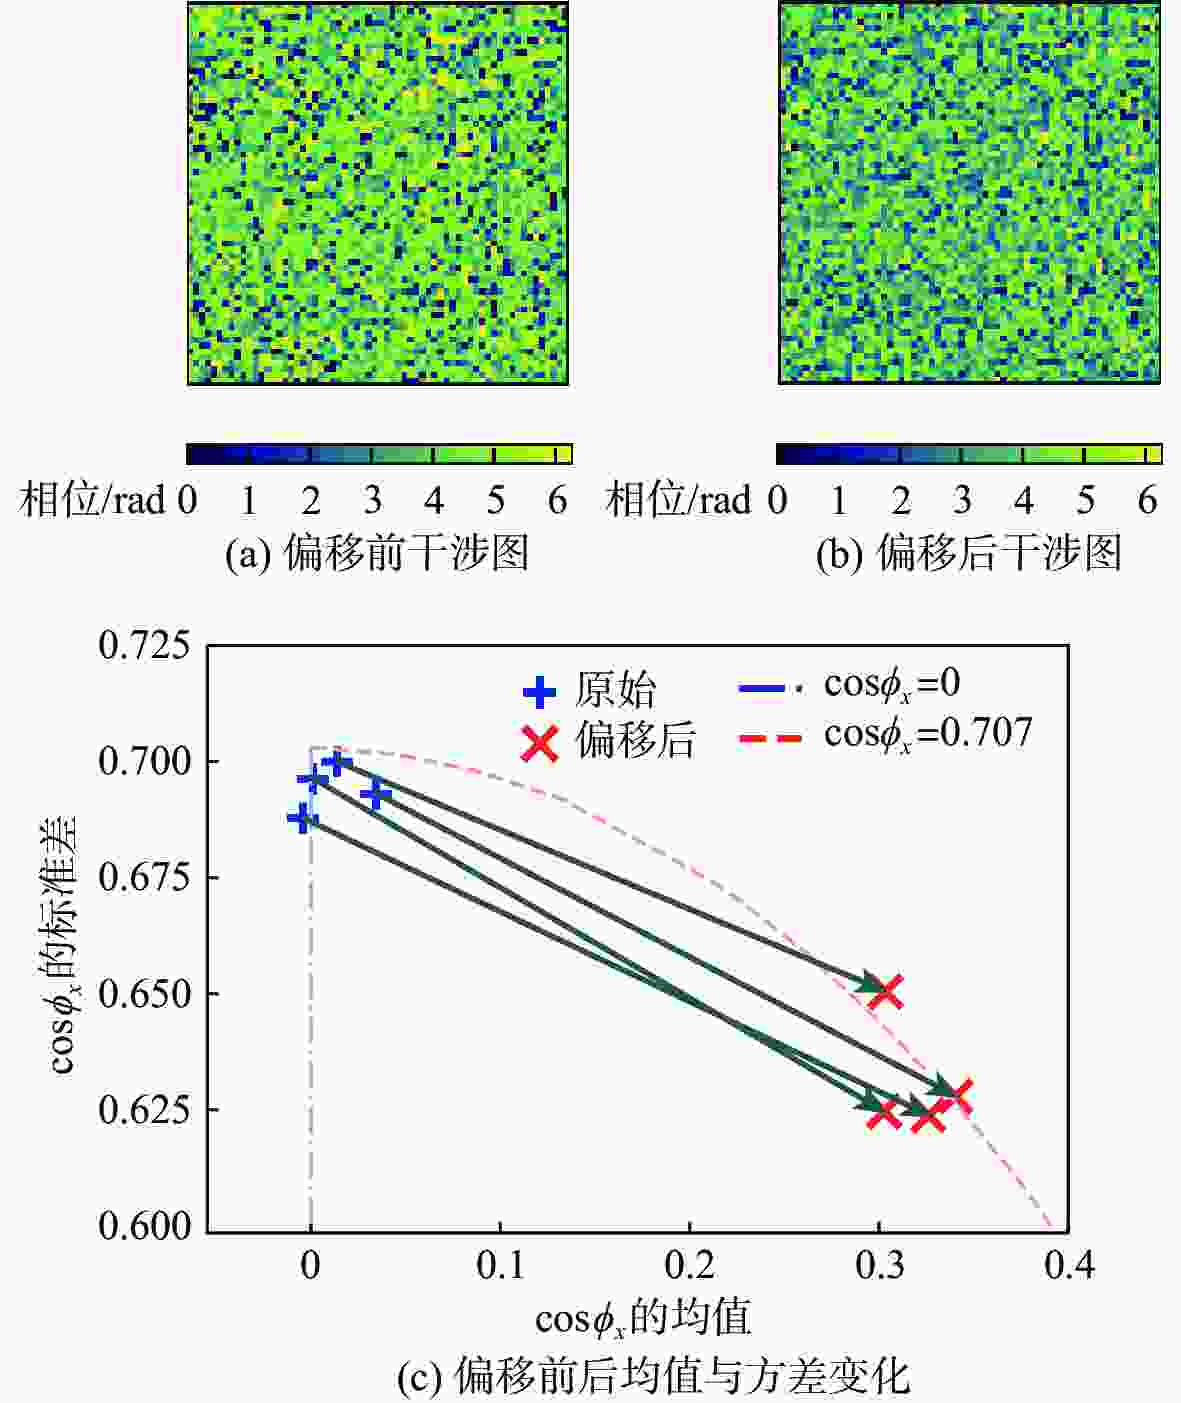
图 3 原始和偏移后的仿真图在32×32的不重叠窗口采样下均值与标准差分布
Figure 3. Mean vs. standard deviation distribution of the original and offset simulation plots sampled in a 32×32non-overlapping window
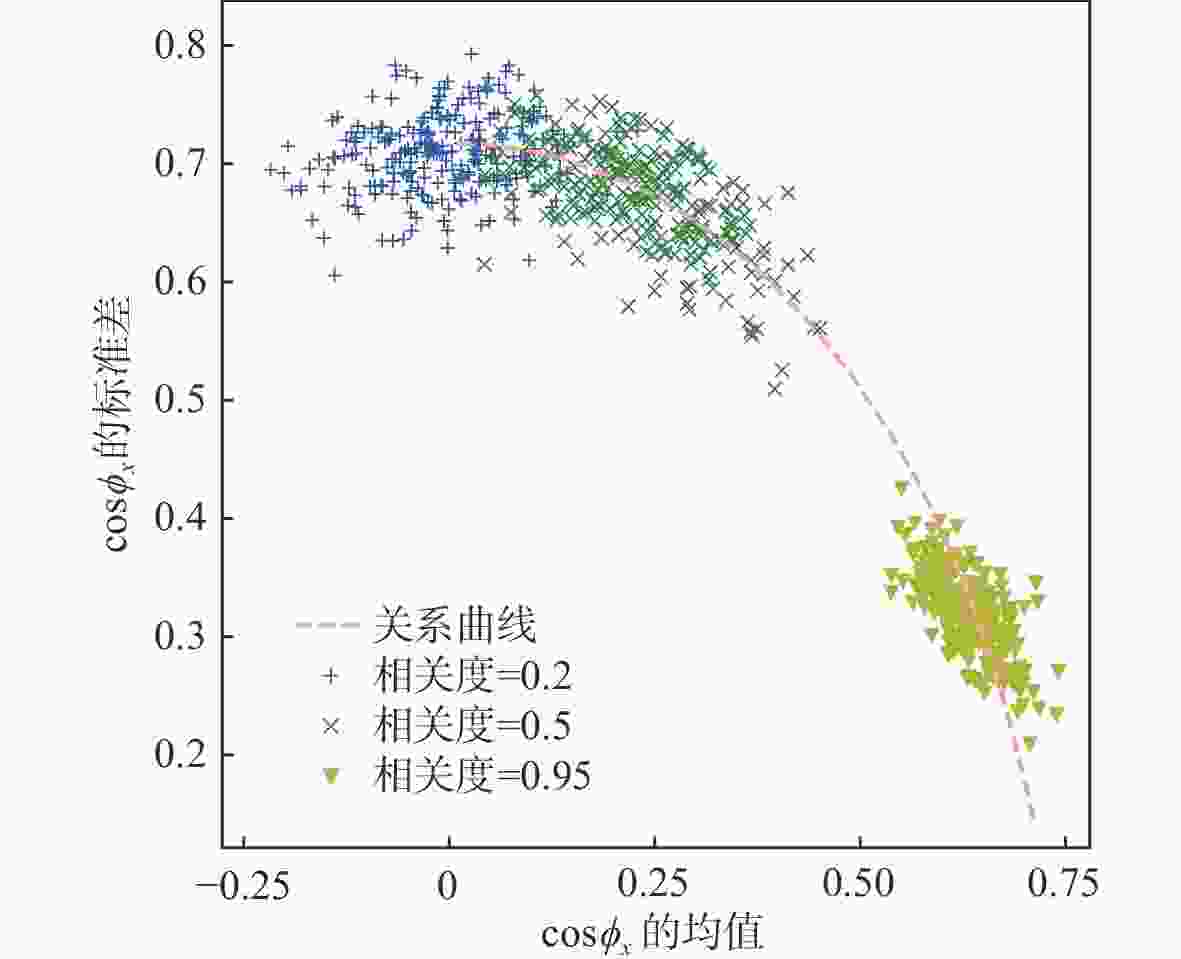
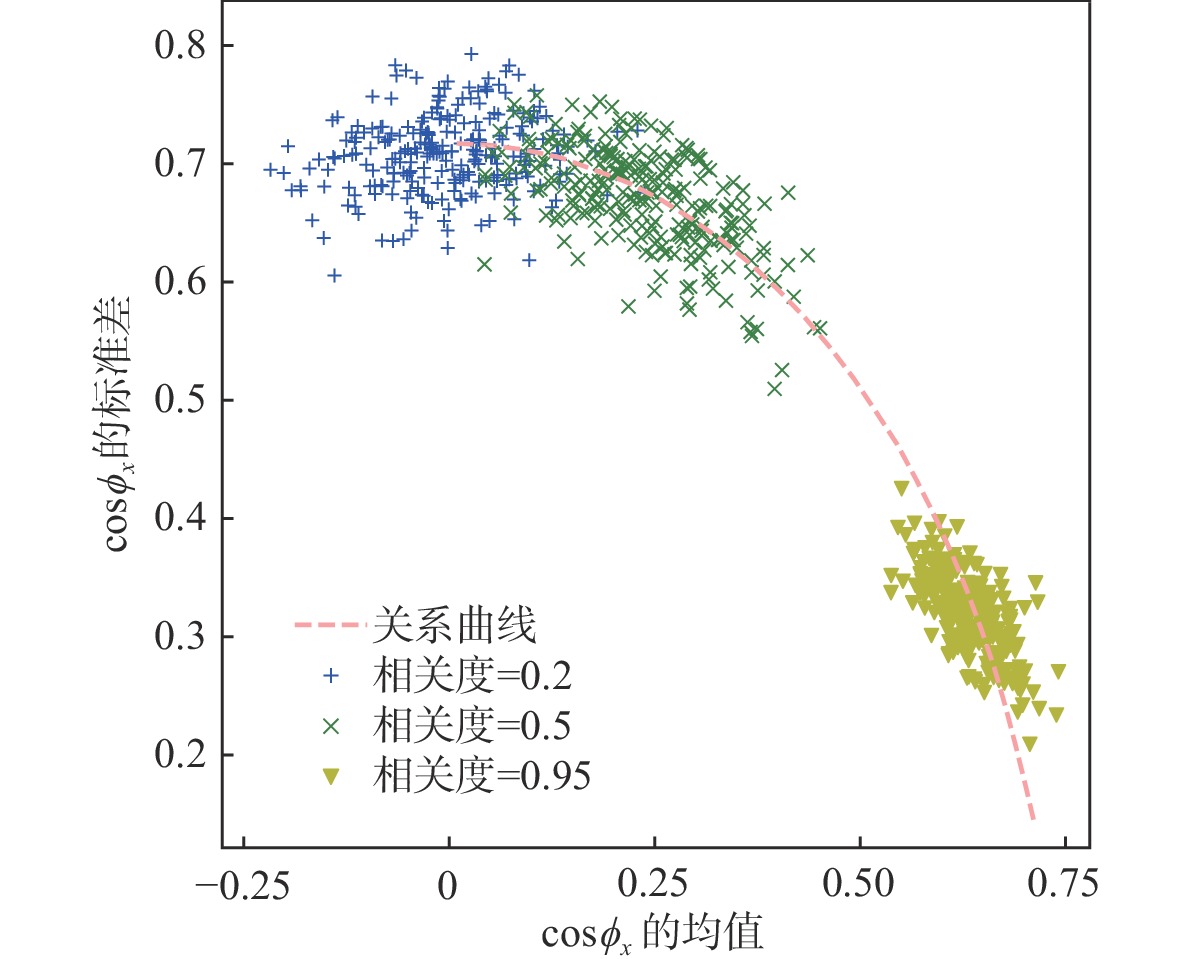
图 8 仿真数据在复数域的实部期望与标准差分布
Figure 8. Scatter plot of the mean and standard deviation of the real part of the simulated data in the complex domain
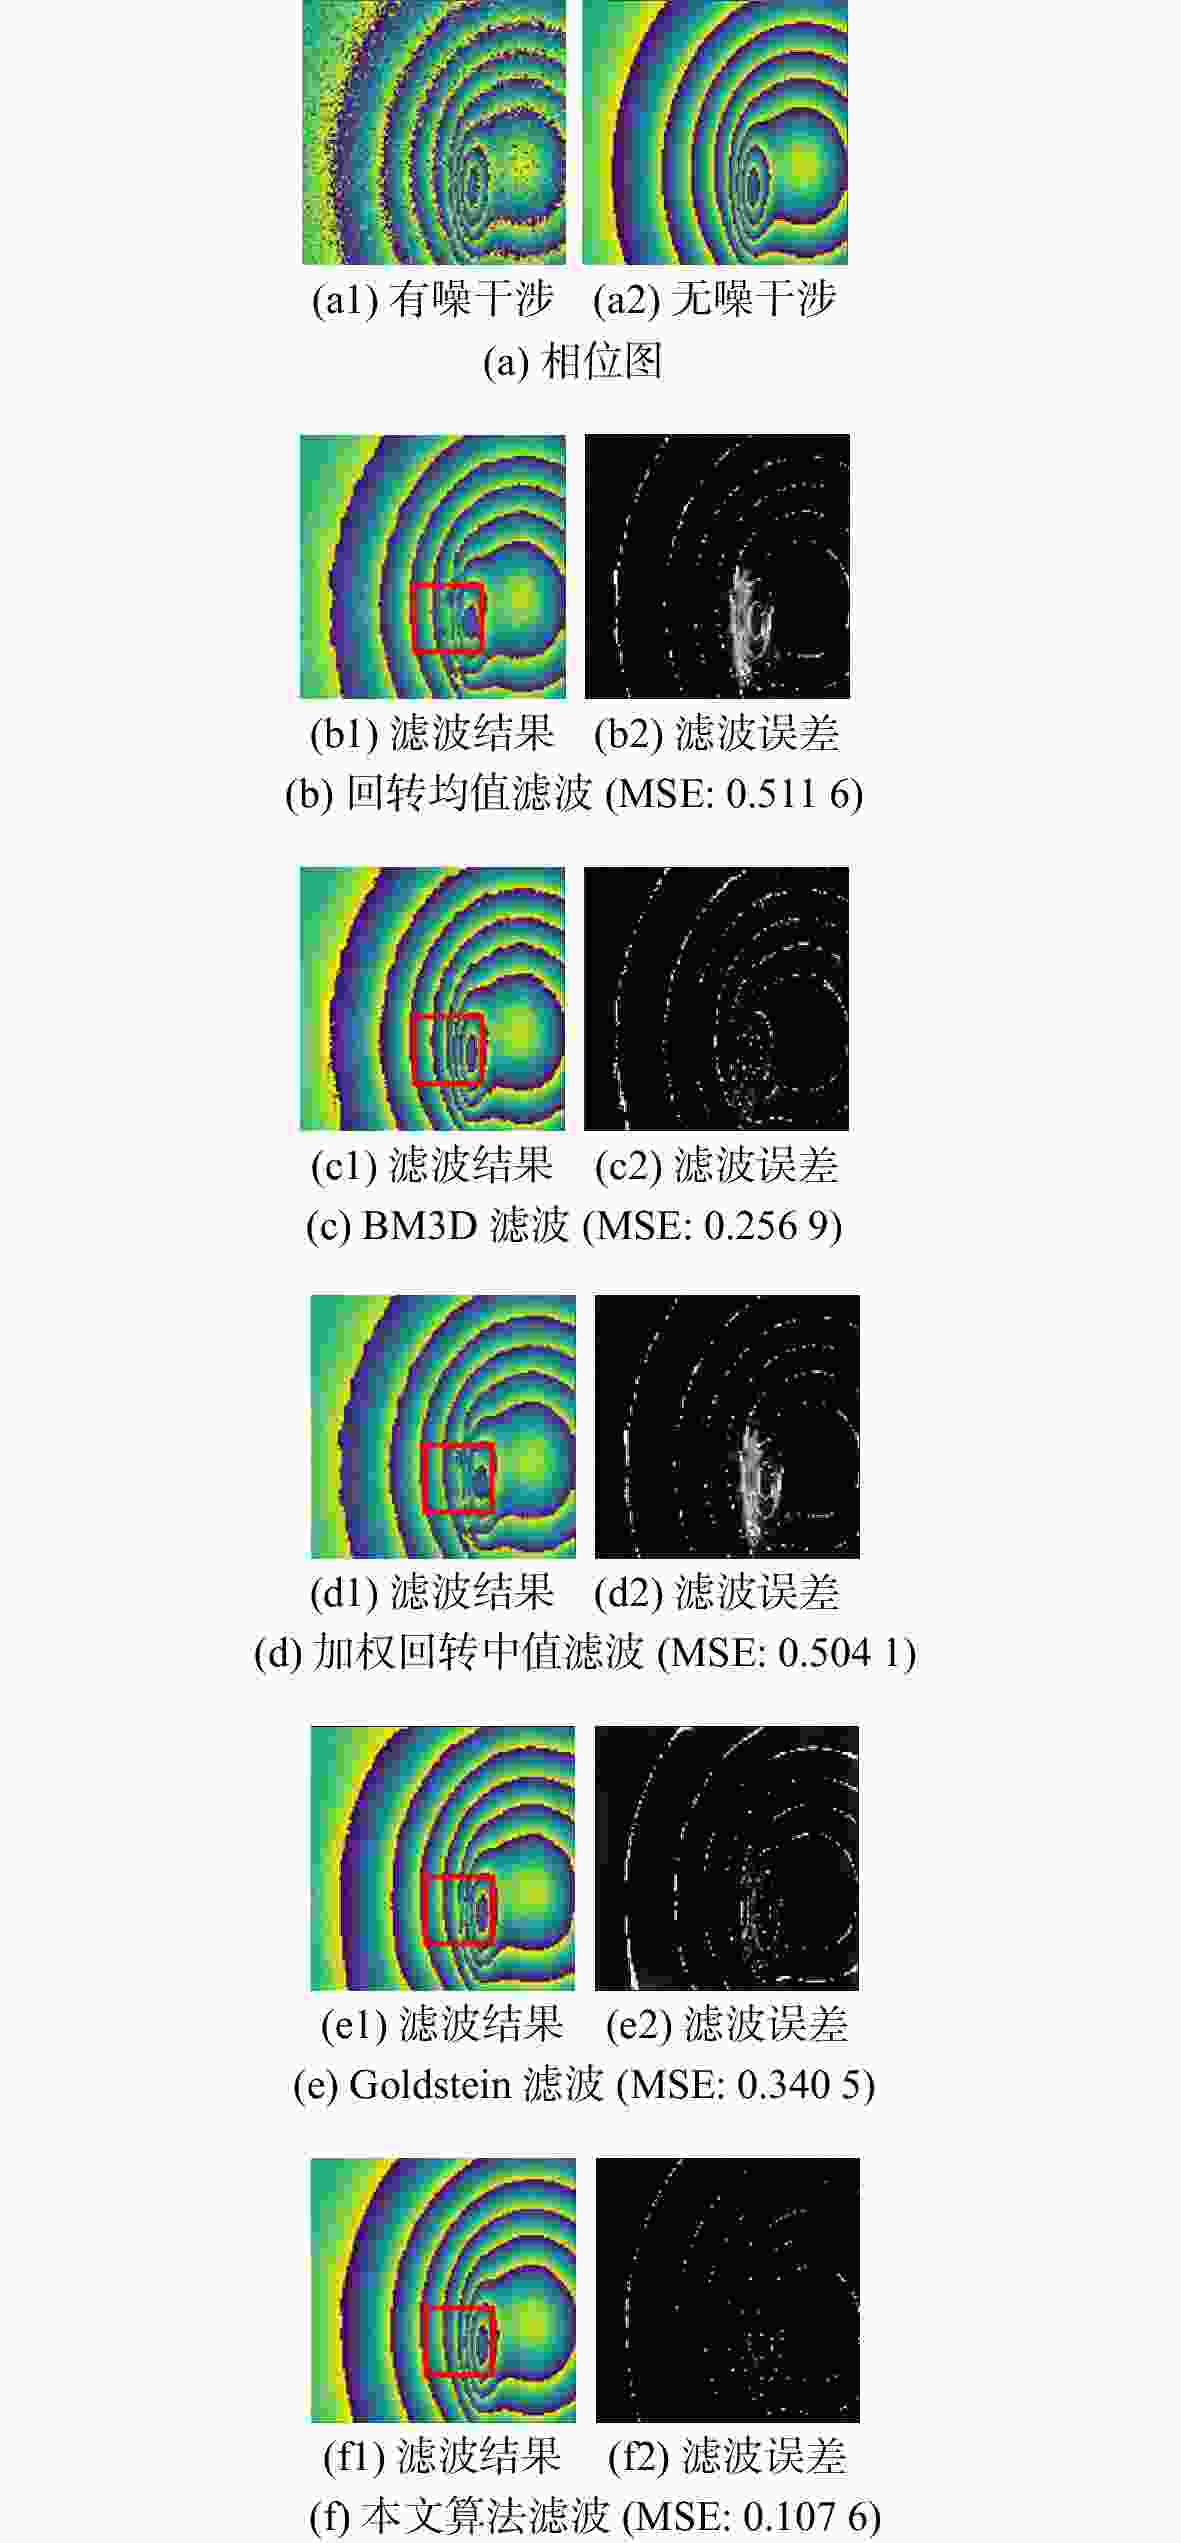
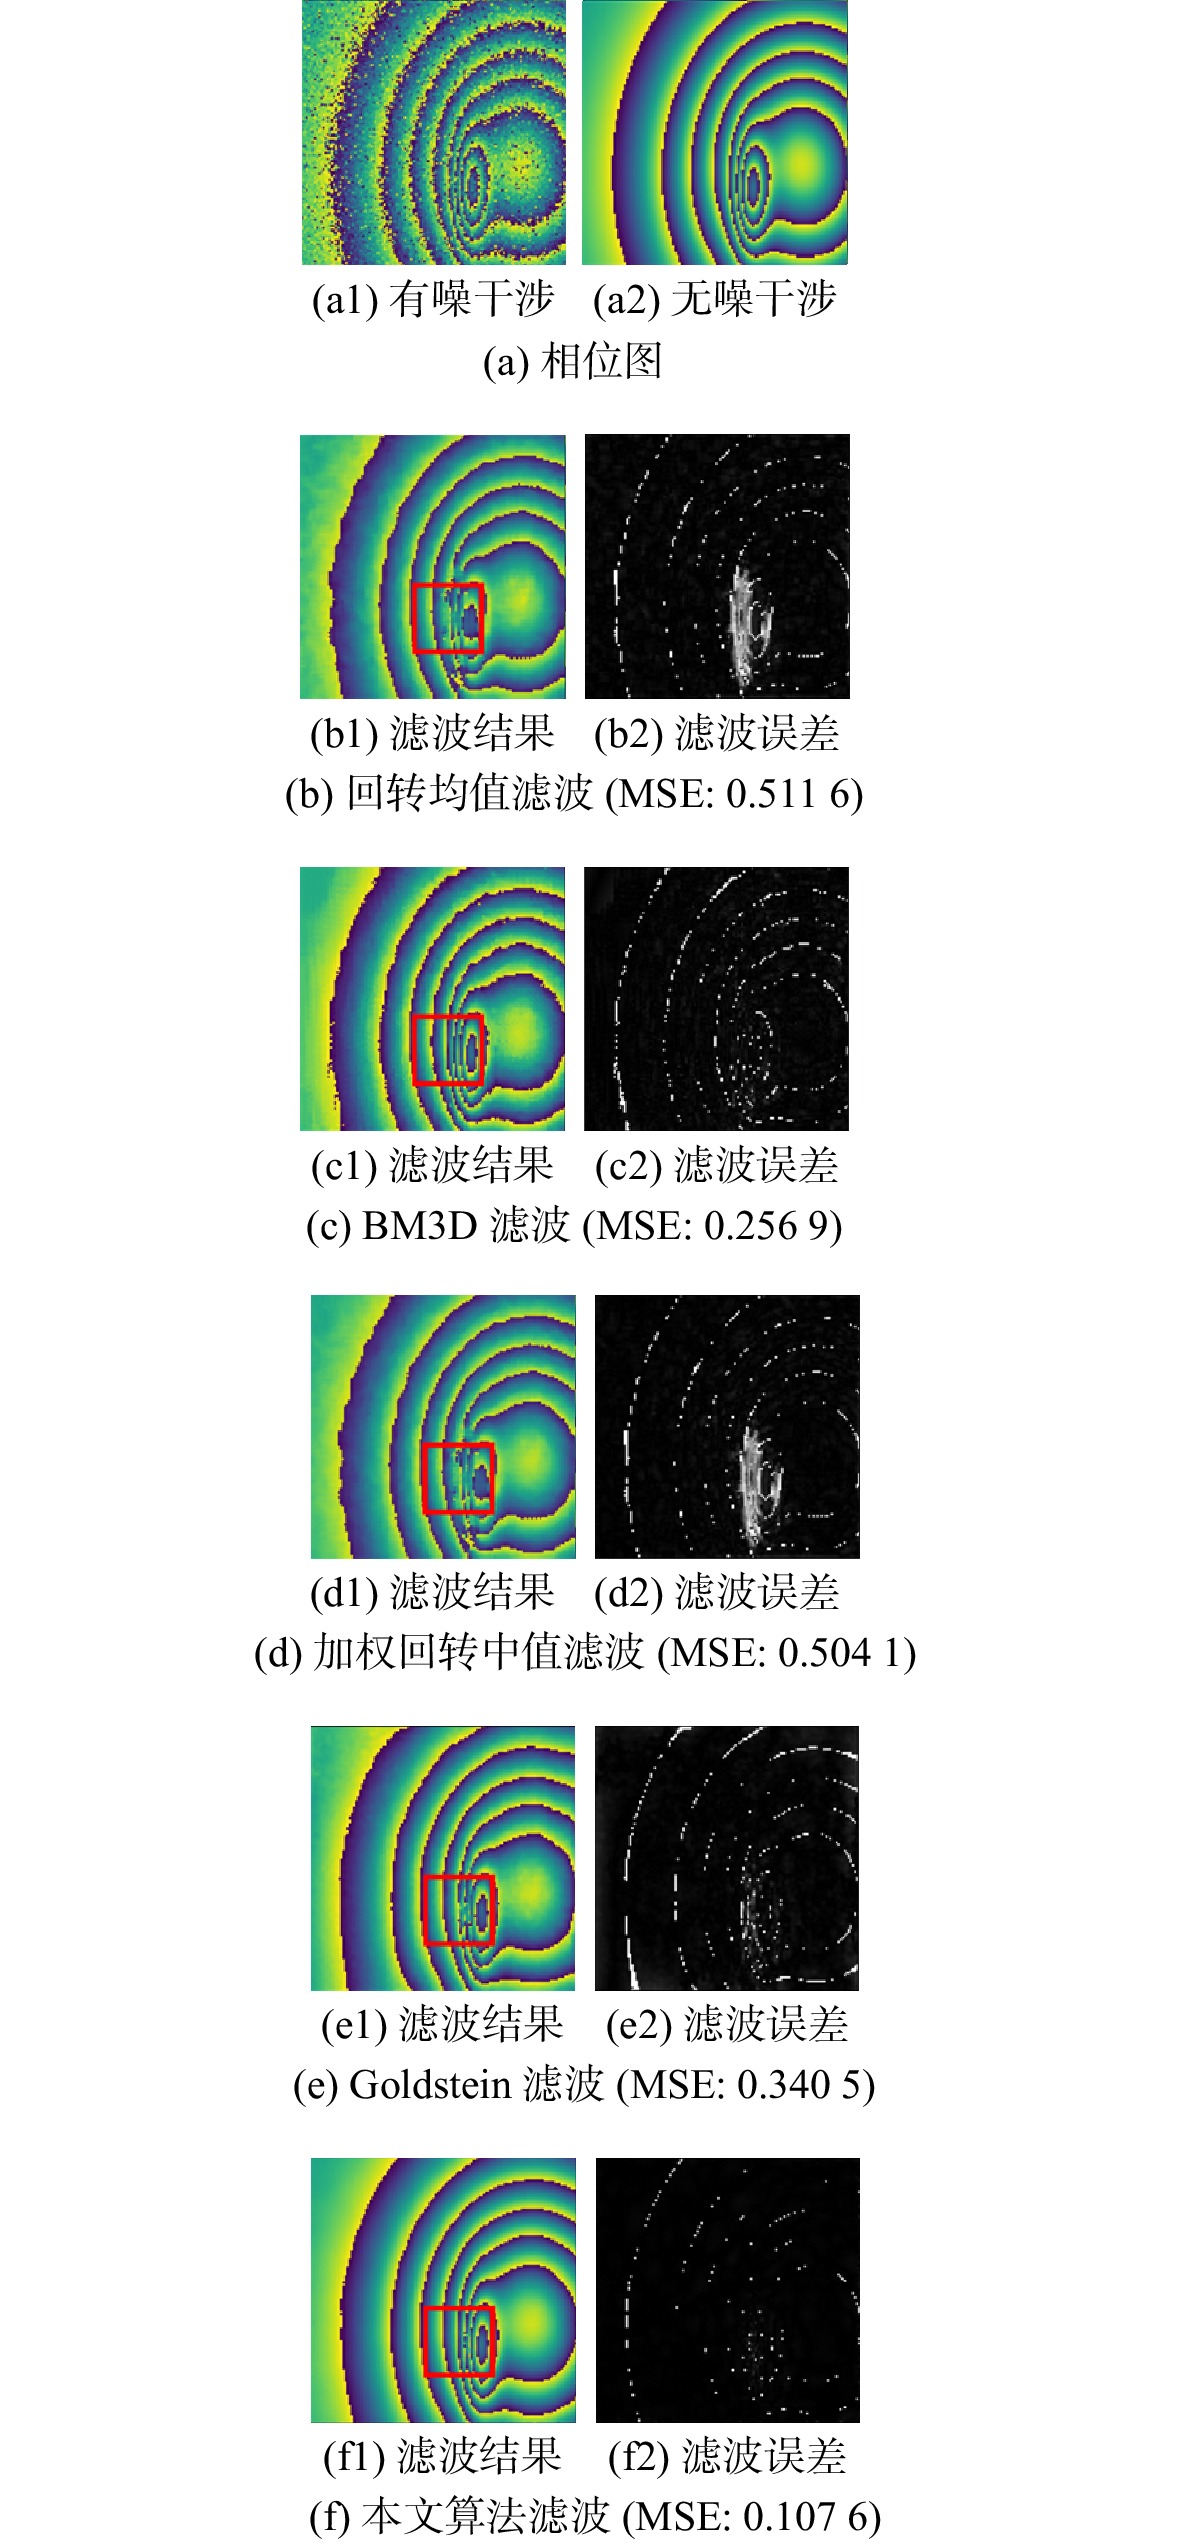
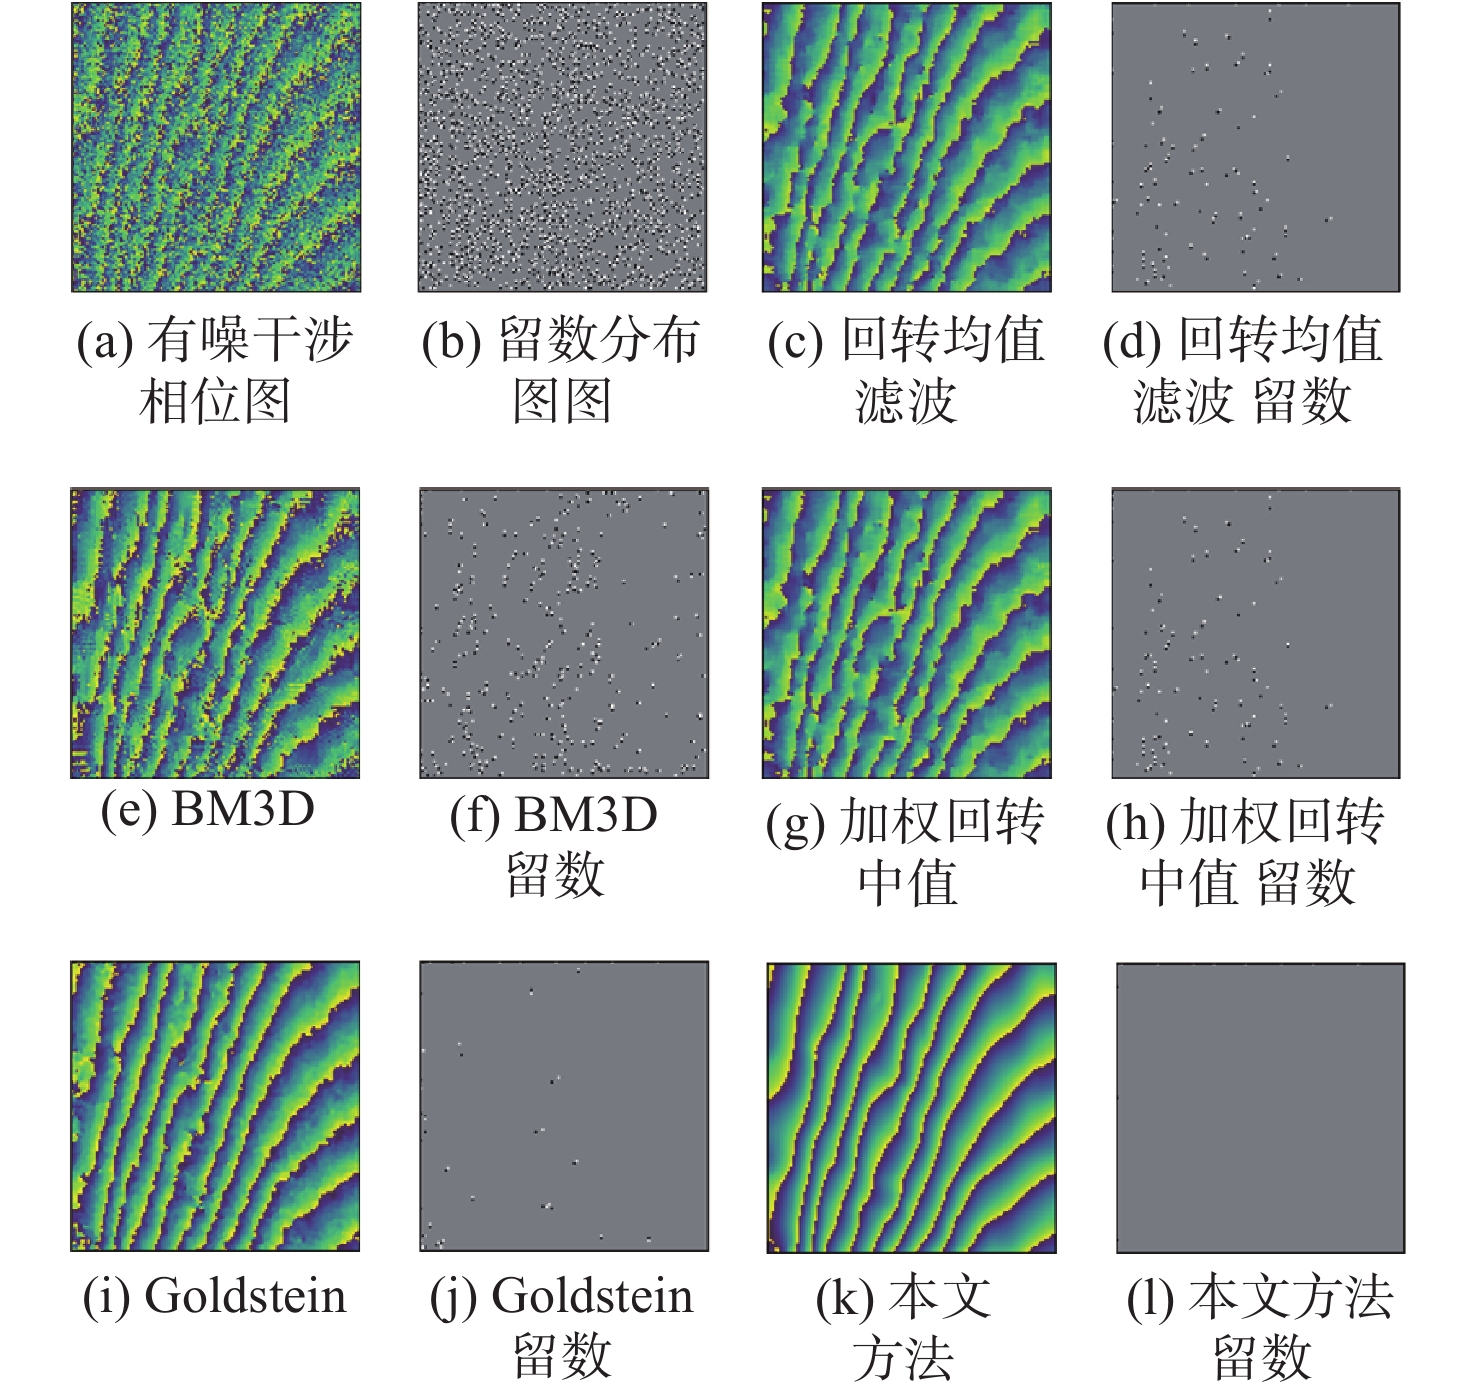
图 9 相干系数为0.9时的对比实验结果
Figure 9. Comparative experimental results for the case of a coherence factor of 0.9
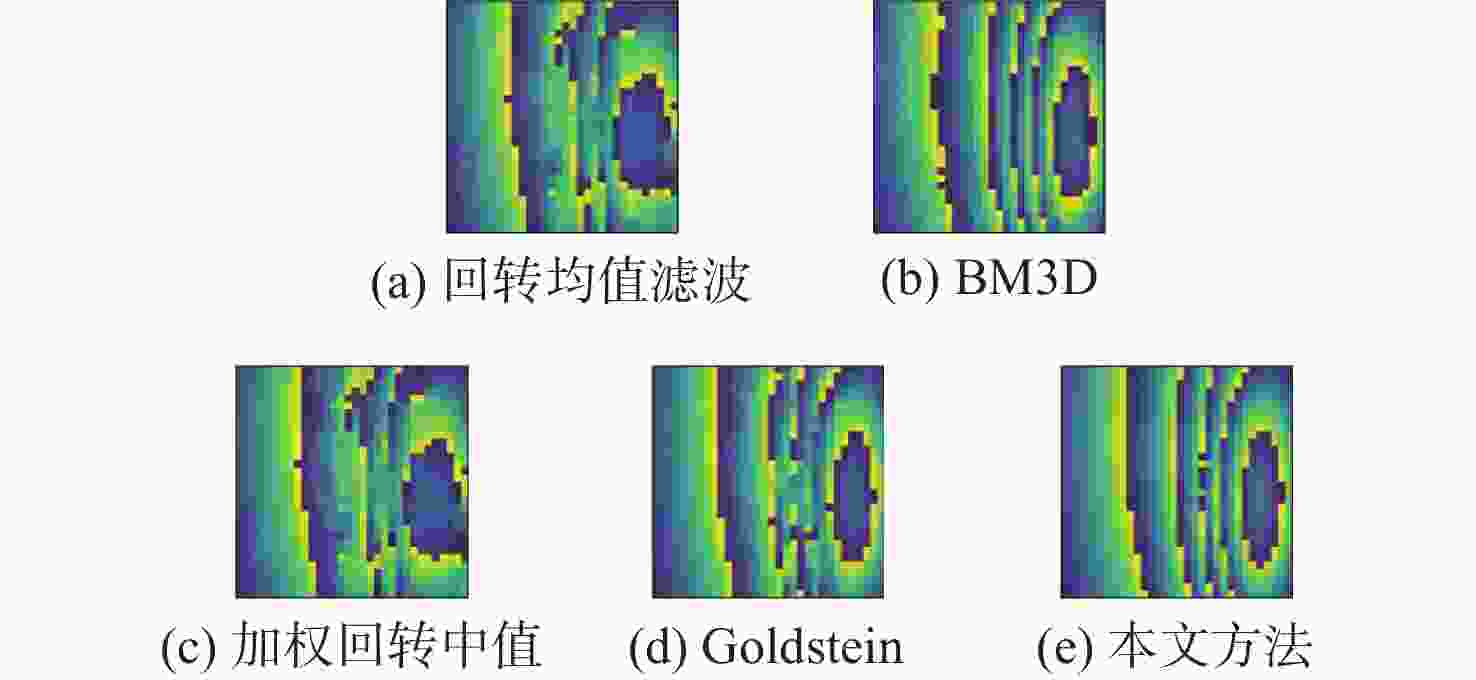
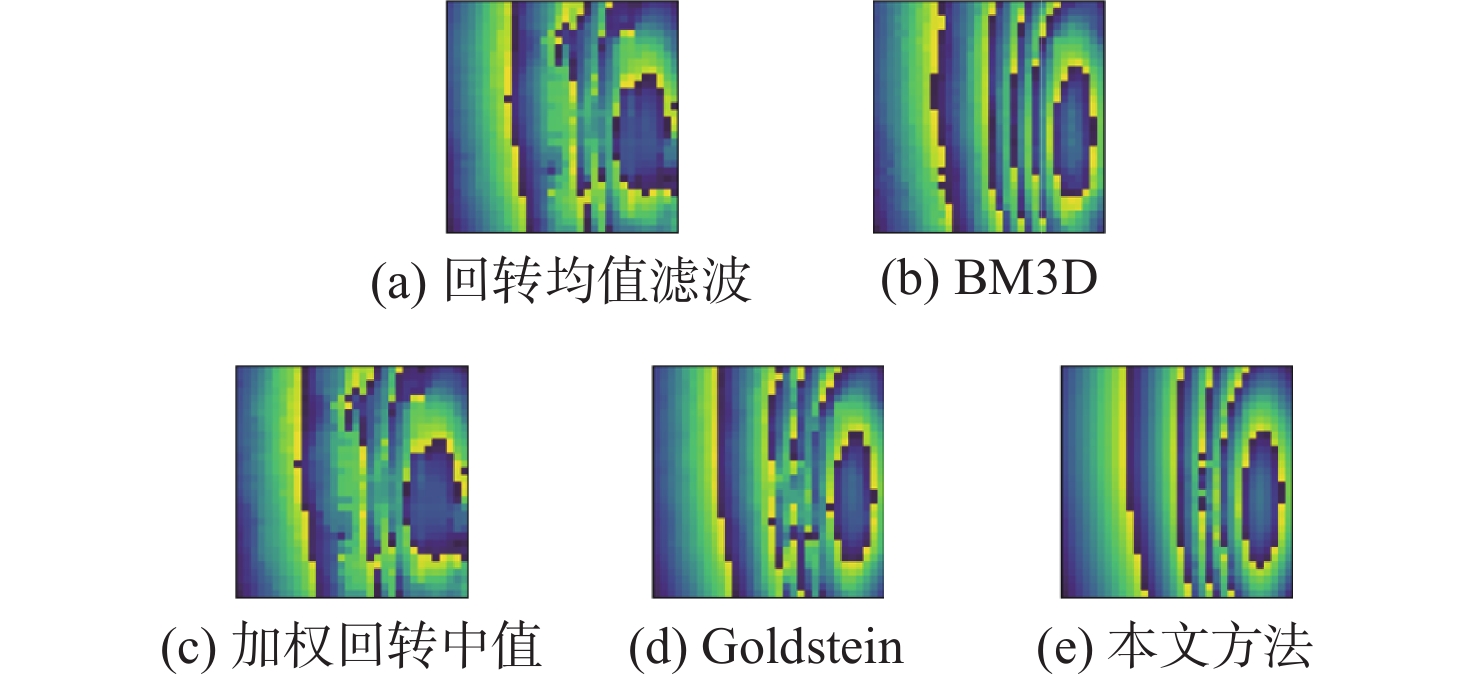
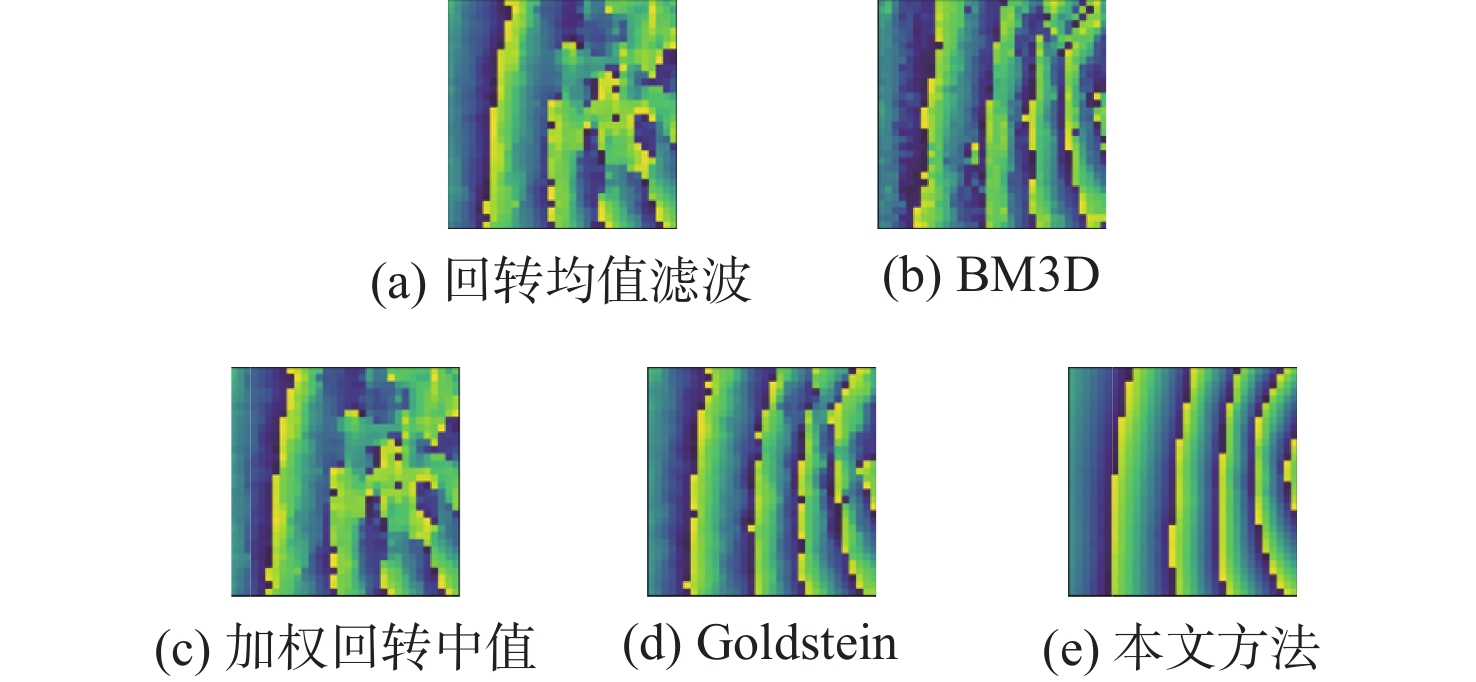
图 10 相干系数为0.9时的细节对比
Figure 10. Comparison of details of experimental results when the coherence coefficient is 0.9
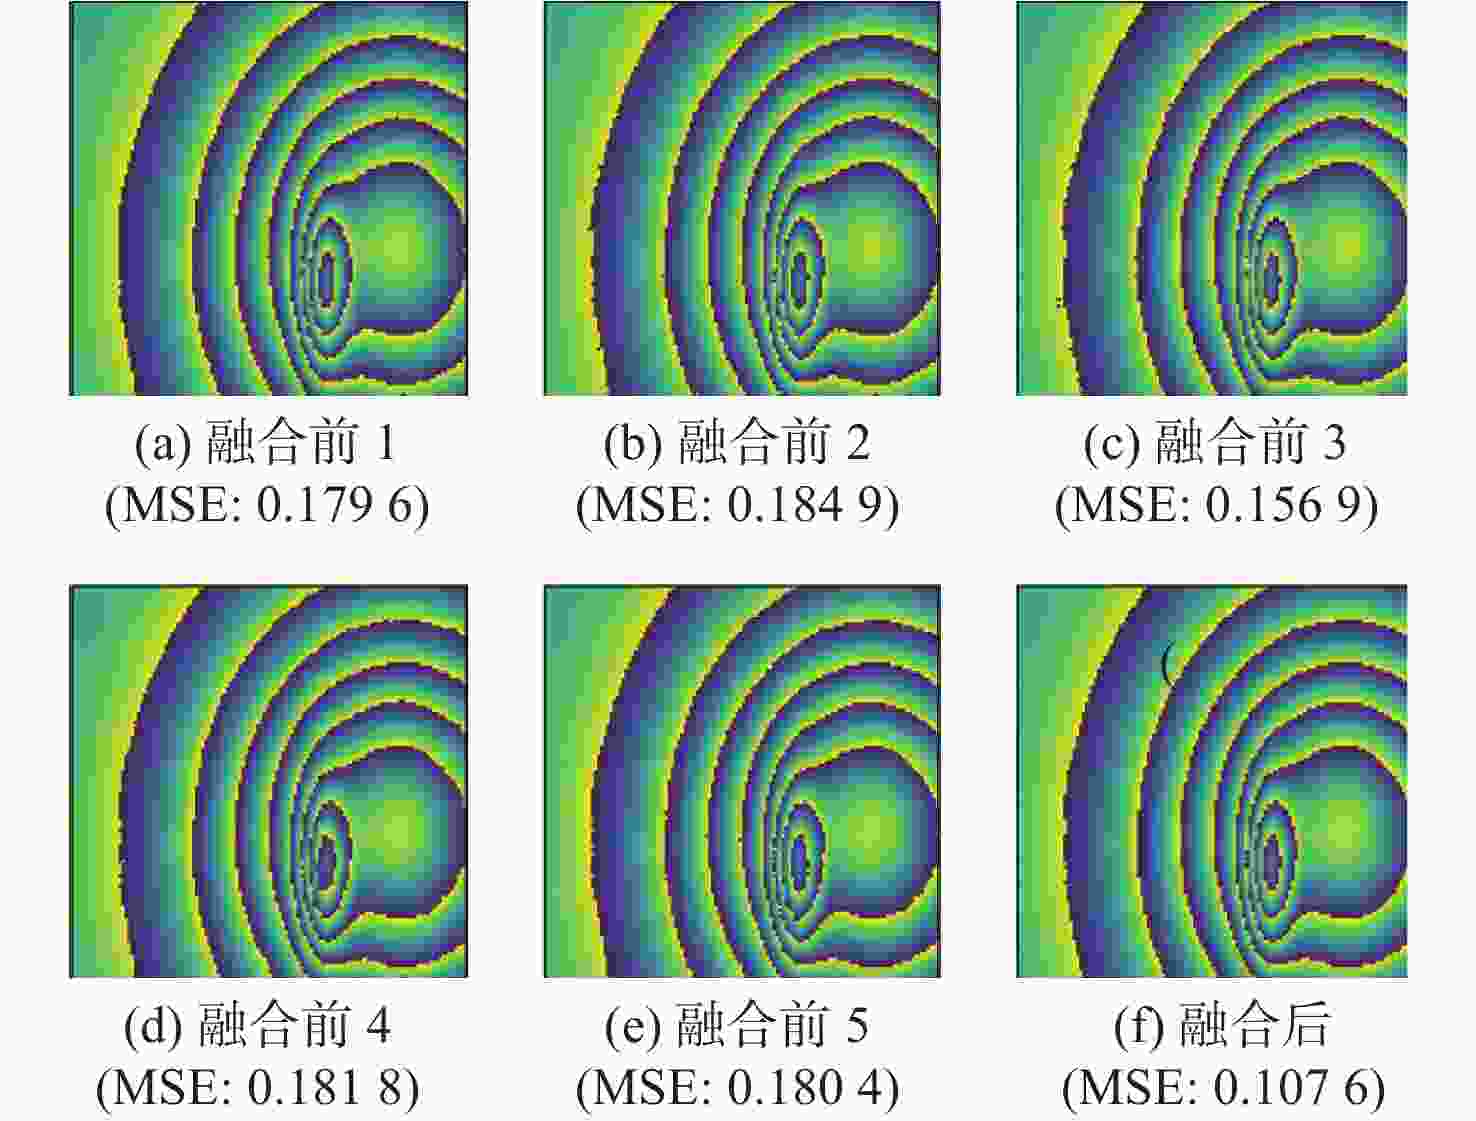
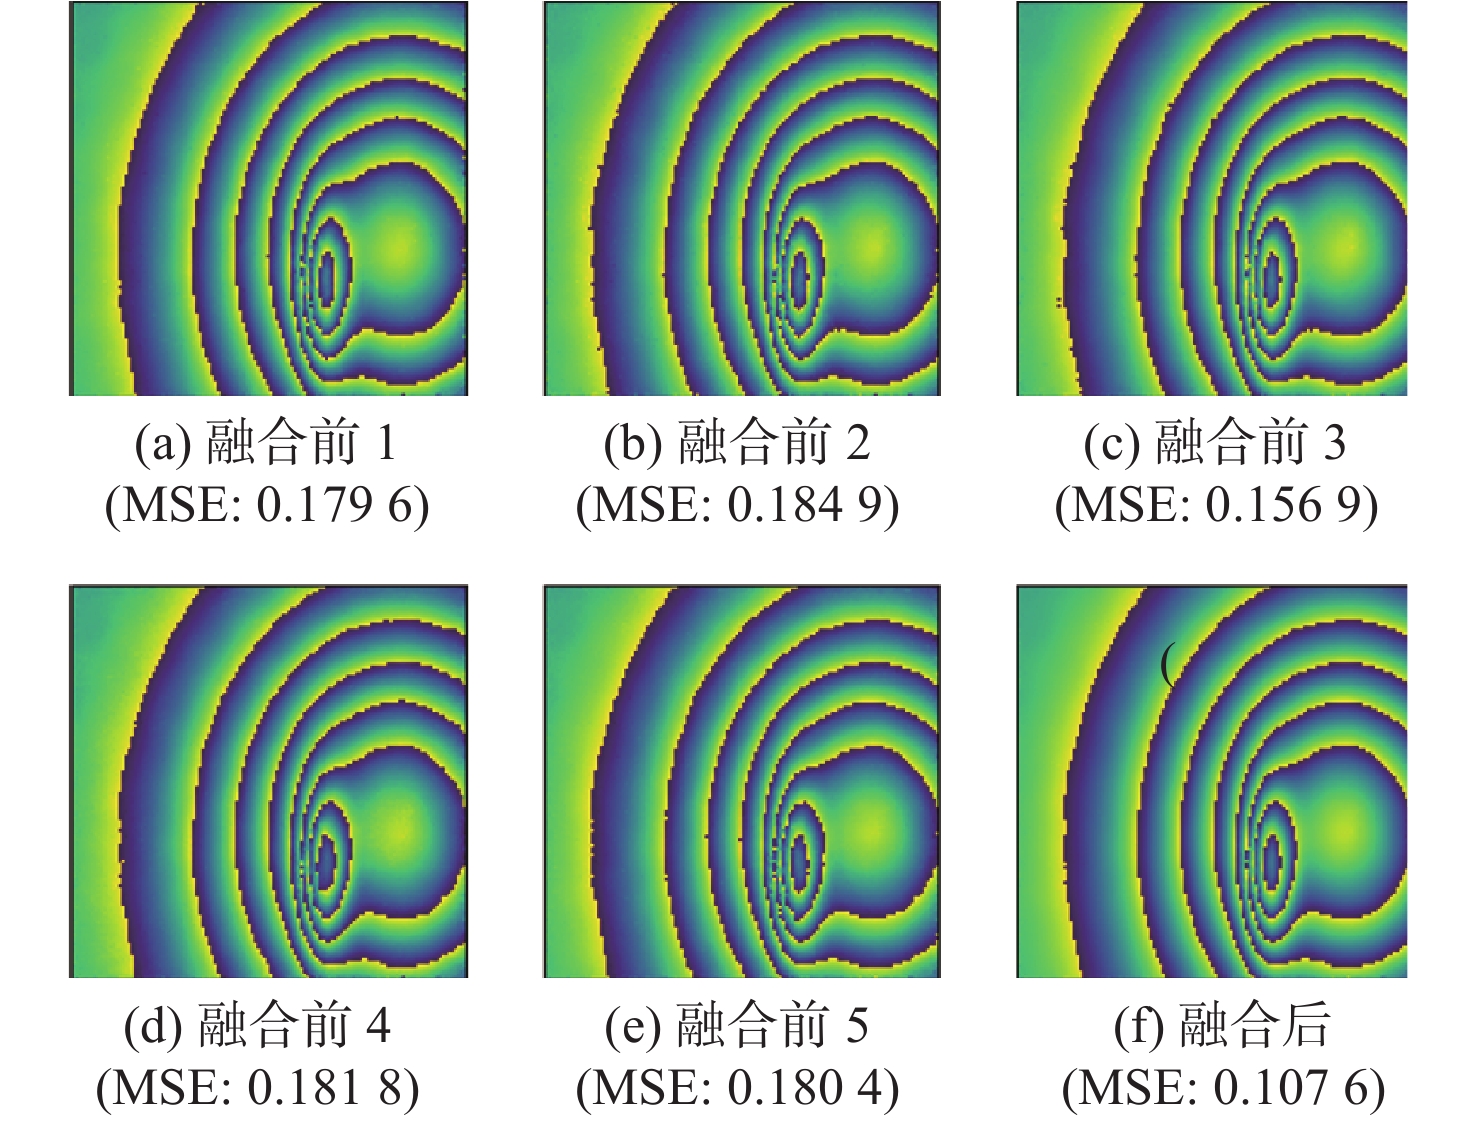
图 11 相干系数为0.9时本文方法子滤波器输出与融合结果
Figure 11. Output and fusion results of each sub-filter of this paper's method with a coherence factor of 0.9

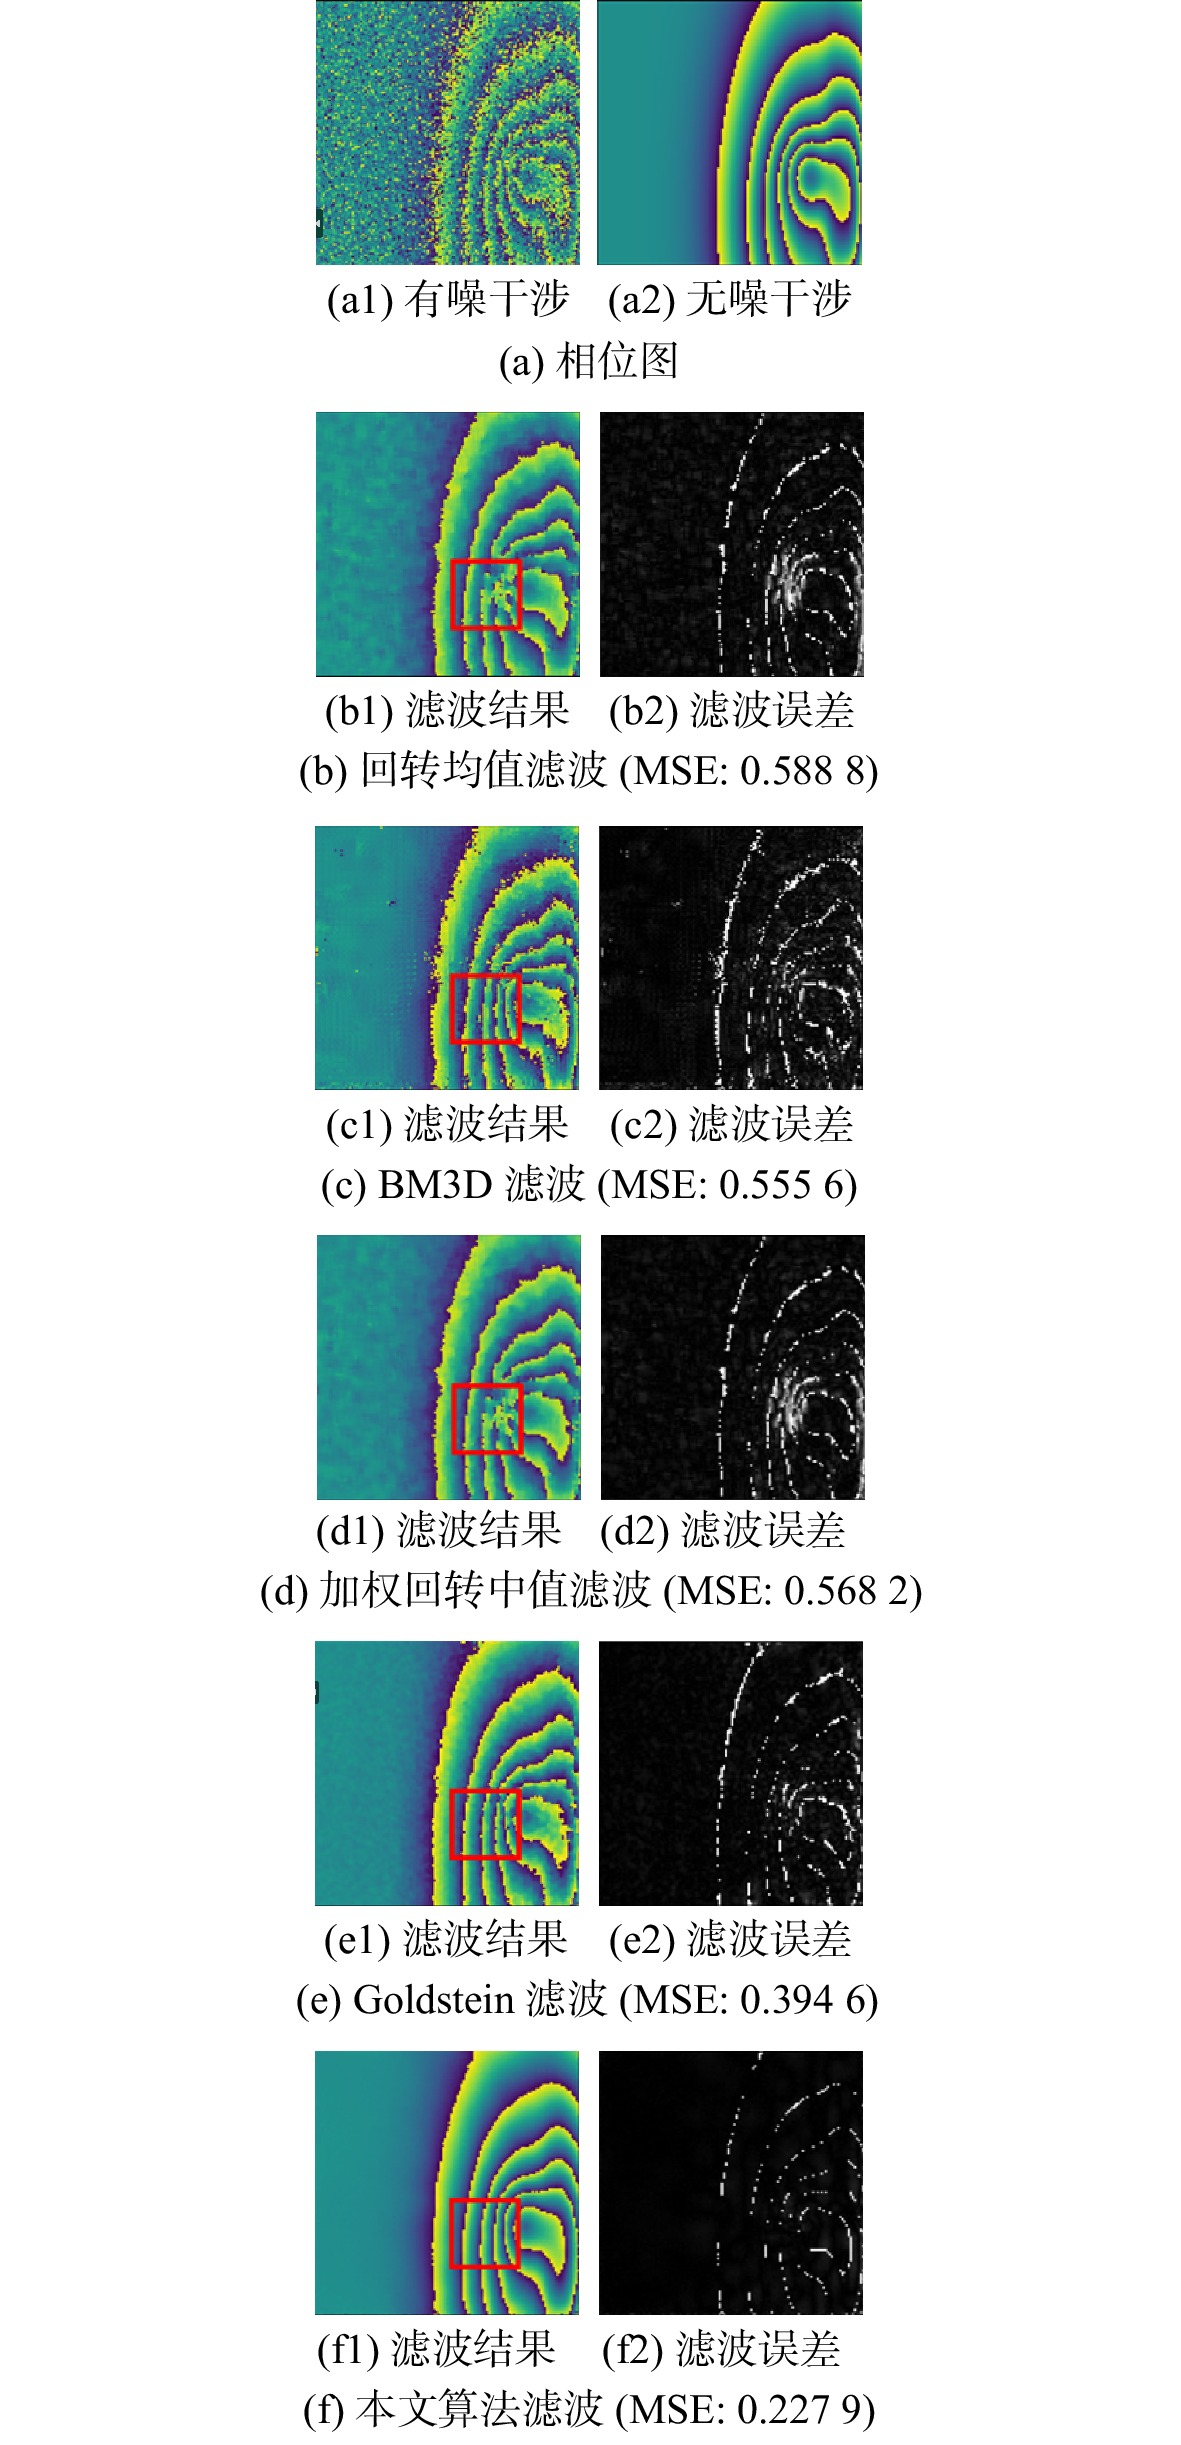
图 12 相干系数为0.6时的对比实验结果
Figure 12. Comparative experimental results for the case of a coherence factor of 0.6
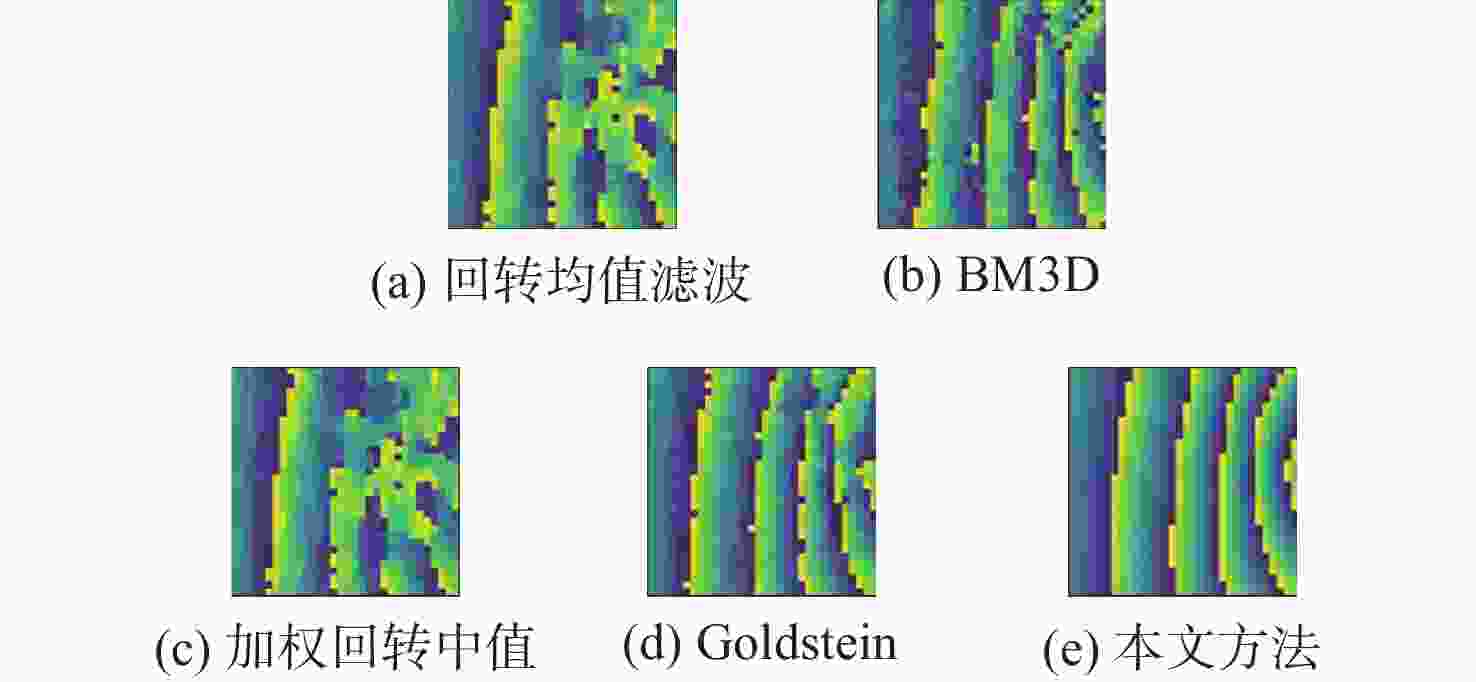
图 13 相干系数为0.6时的细节对比
Figure 13. Comparison of details of experimental results when the coherence coefficient is 0.6
表 1 Resblock ($x,y,{\textit{z}} $)模块参数
Table 1. Parameters of Resblock ($x,y,{\textit{z}} $)
卷积层 卷积核大小 步长 输入通道 输出通道 1 7×7 1×1 x y 2 7×7 1×1 y z 3 7×7 1×1 x z 注:无偏置。  下载: 导出CSV
表 2 子去噪网络参数
Table 2. Parameters of denoising sub-network
序号 网络模块 序号 网络模块 1 Resblock(2,4,8) 6 LeakyReLU(1/5.5) 2 LeakyReLU(1/5.5) 7 Resblock(32,16,8) 3 Resblock(8,16,32) 8 LeakyReLU(1/5.5) 4 LeakyReLU(1/5.5) 9 Resblock(8,4,2) 5 Resblock(32,64,32) 10 Tanh
下载: 导出CSV
表 3 各类滤波方法效果对比
Table 3. Effect comparison of various filtering methods
方法 RMSE 留数点 相干系数为0.9 相干系数为0.6 正 负 回转均值滤波 0.5116 0.5888 84 76 BM3D滤波 0.2659 0.5556 307 298 加权回转中值 0.5041 0.5682 87 80 Goldstein滤波 0.3405 0.3946 31 27 本文方法 0.1110 0.1909 8 3 注:RMSE是仿真数据,留数点是实测数据。
下载: 导出CSV
-
[1] ZHOU L F, YU H W, LAN Y, et al. Artificial intelligence in interferometric synthetic aperture radar phase unwrapping: a review[J]. IEEE Geoscience and Remote Sensing Magazine, 2021, 9(2): 10-28. doi: 10.1109/MGRS.2021.3065811 [2] XU G, GAO Y D, LI J W, et al. InSAR phase denoising: A review of current technologies and future directions[J]. IEEE Geoscience and Remote Sensing Magazine, 2020, 8(2): 64-82. doi: 10.1109/MGRS.2019.2955120 [3] EYRE T S, SAMSONOV S, FENG W P, et al. InSAR data reveal that the largest hydraulic fracturing-induced earthquake in Canada, to date, is a slow-slip event[J]. Scientific Reports, 2022, 12: 2043. doi: 10.1038/s41598-022-06129-3 [4] WU P C, WEI M M, D’HONDT S. Subsidence in coastal cities throughout the world observed by InSAR[J]. Geophysical Research Letters, 2022,49(7):e98477. [5] LEE J S, HOPPEL K W, MANGO S A, et al. Intensity and phase statistics of multilook polarimetric and interferometric SAR imagery[J]. IEEE Transactions on Geoscience and Remote Sensing, 1994, 32(5): 1017-1028. doi: 10.1109/36.312890 [6] GAO Y D, ZHANG S B, ZHANG K F, et al. Frequency domain filtering SAR interferometric phase noise using the amended matrix pencil model[J]. Computer Modeling in Engineering & Sciences, 2019, 119(2): 349-363. [7] DELEDALLE C A, DENIS L, TUPIN F. NL-InSAR: Nonlocal interferogram estimation[J]. IEEE Transactions on Geoscience and Remote Sensing, 2011, 49(4): 1441-1452. doi: 10.1109/TGRS.2010.2076376 [8] DANIELYAN A, KATKOVNIK V, EGIAZARIAN K. BM3D frames and variational image deblurring[J]. IEEE Transactions on Image Processing: A Publication of the IEEE Signal Processing, Society, 2012, 21(4): 1715-1728. doi: 10.1109/TIP.2011.2176954 [9] GOLDSTEIN R M, WERNER C L. Radar interferogram filtering for geophysical applications[J]. Geophysical Research Letters, 1998, 25(21): 4035-4038. [10] YAN K, YU Y J, SUN T, et al. Wrapped phase denoising using convolutional neural networks[J]. Optics and Lasers in Engineering, 2020, 128: 105999. doi: 10.1016/j.optlaseng.2019.105999 [11] GOLDSTEIN R M, ENGELHARDT H, KAMB B, et al. Satellite radar interferometry for monitoring ice sheet motion: Application to an antarctic ice stream[J]. Science, 1993, 262(5139): 1525-1530. doi: 10.1126/science.262.5139.1525 [12] LEE J S, PAPATHANASSIOU K P, AINSWORTH T L, et al. A new technique for noise filtering of SAR interferometric phase images[J]. IEEE Transactions on Geoscience and Remote Sensing, 1998, 36(5): 1456-1465. doi: 10.1109/36.718849 [13] LOPEZ-MARTINEZ C, FABREGAS X. Modeling and reduction of SAR interferometric phase noise in the wavelet domain[J]. IEEE Transactions on Geoscience and Remote Sensing, 2002, 40(12): 2553-2566. doi: 10.1109/TGRS.2002.806997 [14] ZHANG J H, ZHU Y G, LI W Y, et al. DRNet: a deep neural network with multi-layer residual blocks improves image denoising[J]. IEEE Access, 2021, 9: 79936-79946. doi: 10.1109/ACCESS.2021.3084951 [15] KRIZHEVSKY A, SUTSKEVER I, HINTON G E. ImageNet classification with deep convolutional neural networks[J]. Communications of the ACM, 2017, 60(6): 84-90. doi: 10.1145/3065386 [16] LANGNER A, HIRATA Y, SAITO H, et al. Spectral normalization of SPOT 4 data to adjust for changing leaf phenology within seasonal forests in Cambodia[J]. Remote Sensing of Environment, 2014, 143: 122-130. doi: 10.1016/j.rse.2013.12.012 [17] BERA S, SHRIVASTAVA V K. Analysis of various optimizers on deep convolutional neural network model in the application of hyperspectral remote sensing image classification[J]. International Journal of Remote Sensing, 2020, 41(7): 2664-2683. doi: 10.1080/01431161.2019.1694725 -

 下载:
下载:


 点击查看大图
计量
- 文章访问数: 186
- HTML全文浏览量: 68
- PDF下载量: 4
- 被引次数: 0
