


No reference quality assessment method for contrast-distorted images based on three elements of color
-
摘要:
图像质量评价是图像处理领域中基本且具有挑战性的问题。对比度失真对图像质量的感知影响较大,目前针对对比度失真图像的无参考图像质量评价研究相对较少。基于此,提出了基于彩色三要素的无参考对比度失真图像质量评价方法,利用彩色三要素的亮度、色调和饱和度3个参数实现了对比度失真图像的质量评价方法。在亮度方面,提取矩特征及图像直方图与均匀分布之间的Kullback-Leibler散度特征。在色调和饱和度方面,分别在HSV空间的H和S通道中提取颜色加权局部二值模式(LBP)直方图特征。利用AdaBoosting BP神经网络训练预测模型。在5个标准图像数据库中进行广泛的实验分析和交叉验证,结果表明,所提方法与现有的对比度失真图像质量评价方法相比,性能有明显的提升。
Abstract:Image quality assessment is a basic and challenging problem in the field of image processing, among which the contrast distortion has a greater impact on the perception of image quality. However, there is relatively little research on the no-reference image quality assessment of contrast-distorted images. This paper proposes a no-reference contrast-distorted image quality assessment method based on the three elements of color. The three parameters of brightness, hue and saturation of the three elements of color are used to realize the assessment of contrast-distorted images. First, in terms of brightness, the moment feature and the Kullback-Leibler divergence between the image histogram and the uniform distribution are extracted. Secondly, in terms of hue and saturation, the color-weighted local binary patterns (LBP) histogram features are extracted from the H and S channels of the HSV space, respectively. Finally, the AdaBoosting BP neural network is used to train the prediction model. Through extensive experimental analysis and cross-validation in five standard image databases, the experimental results show that the performance of this method is significantly improved compared with the existing contrast-distorted image quality assessment methods.
-

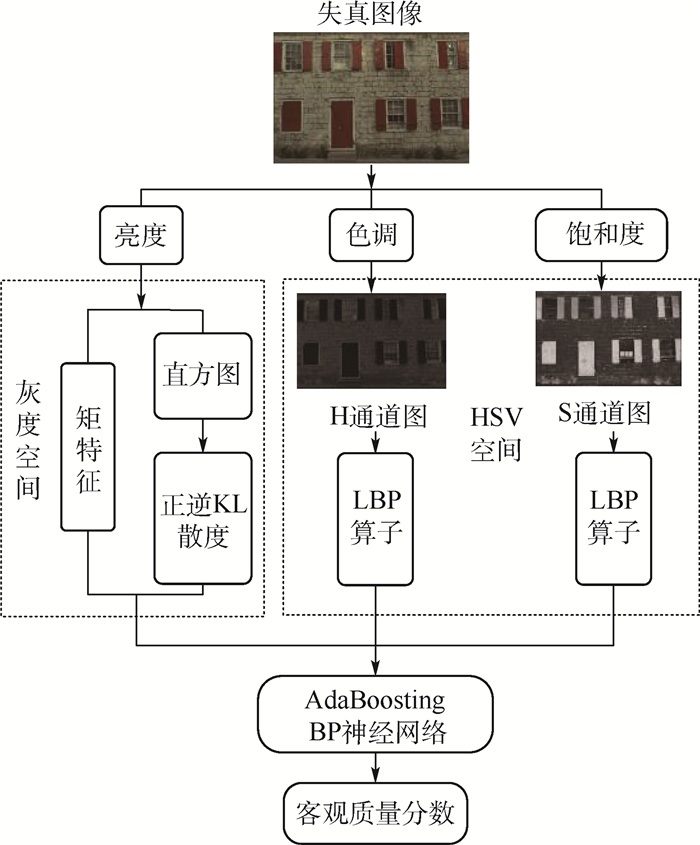
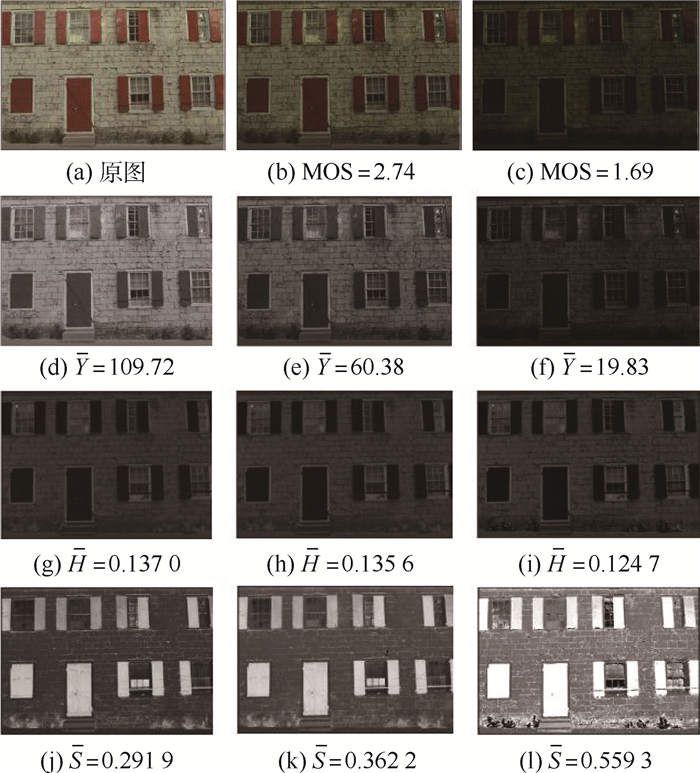
图 1 原图及其对比度失真版本图像的相关参数
Figure 1. Related parameters of original image and its contrast-distorted version

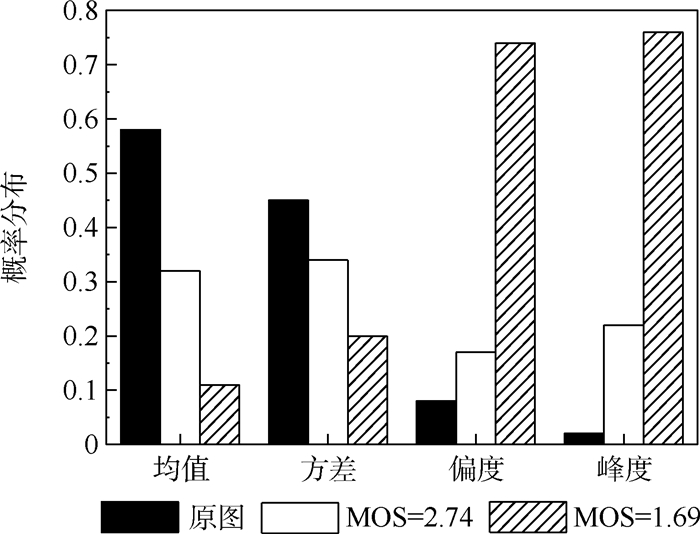
图 4 均匀分布、原图及不同程度对比度失真图像的概率密度
Figure 4. Probability density of uniform distribution, original image and different degree of contrast distortion image

图 5 H和S通道下LBP各模式的累积值
Figure 5. Accumulated amplitude of each mode of LBP under H and S channels
表 4 五个对比度失真图像数据库上本文方法和其他方法的性能比较
Table 4. Performance comparison of the proposed method and other methods on five contrast-distorted image databases
数据库 秩相关系数 FR RR QMC[1] PCQI[2] QCCI[3] RIQMC[4] RCIQM[5] CIQM[6] CID2013[15] PLCC 0.806 0.924 6 0.934 5 0.899 5 0.918 7 0.913 9 SRCC 0.767 4 0.923 2 0.929 3 0.900 5 0.920 3 0.920 6 KRCC 0.578 5 0.758 0 0.762 0 0.716 2 0.754 3 0.724 0 CCID2014[4] PLCC 0.895 2 0.872 1 0.888 0 0.872 6 0.884 5 0.885 3 SRCC 0.870 5 0.886 9 0.895 7 0.846 5 0.856 5 0.869 7 KRCC 0.684 6 0.682 0 0.702 1 0.650 7 0.669 5 0.685 4 CSIQ[16] PLCC 0.960 5 0.948 2 0.946 6 0.965 2 0.964 5 0.946 2 SRCC 0.953 2 0.948 8 0.951 2 0.957 9 0.956 9 0.949 6 KRCC 0.816 5 0.814 4 0.798 2 0.827 9 0.819 8 0.810 5 TID2008[17] PLCC 0.803 6 0.882 1 0.881 4 0.858 5 0.880 7 0.892 2 SRCC 0.752 9 0.900 2 0.898 9 0.809 5 0.857 8 0.868 1 KRCC 0.571 9 0.722 6 0.711 9 0.622 4 0.670 5 0.689 0 TID2013[18] PLCC 0.797 2 0.873 8 0.873 3 0.865 1 0.886 6 0.897 0 SRCC 0.733 6 0.917 5 0.912 6 0.804 4 0.854 1 0.862 1 KRCC 0.551 3 0.709 3 0.685 4 0.617 8 0.667 5 0.687 3 加权平均值 PLCC 0.851 4 0.892 0 0.900 6 0.883 0 0.898 5 0.899 4 SRCC 0.815 3 0.906 6 0.911 0 0.856 7 0.879 2 0.886 6 KRCC 0.633 4 0.719 4 0.722 4 0.671 0 0.701 0 0.704 6 数据库 秩相关系数 NR CDIQA[7] ICDIQA[8] NIQMC[9] BIQME[10] HEFCS[11] 文献[12] 文献[13] 本文方法 CID2013[15] PLCC 0.866 8 0.912 9 0.869 1 0.900 4 0.897 3 0.943 5 0.964 6 0.968 9 SRCC 0.850 0 0.908 1 0.866 8 0.902 3 0.877 7 0.933 8 0.960 3 0.966 2 KRCC 0.658 8 0.703 5 0.669 0 0.722 3 0.690 6 0.781 4 0.835 4 0.848 0 CCID2014[4] PLCC 0.837 1 0.877 9 0.843 8 0.858 8 0.865 0 0.923 5 0.910 9 0.925 4 SRCC 0.802 6 0.851 2 0.811 3 0.830 9 0.842 6 0.911 8 0.902 3 0.914 5 KRCC 0.603 6 0.659 8 0.605 2 0.630 5 0.639 5 0.723 6 0.728 5 0.748 3 CSIQ[16] PLCC 0.666 3 0.881 7 0.874 7 0.810 6 0.941 7 0.936 8 0.926 9 0.965 5 SRCC 0.585 6 0.814 5 0.853 3 0.784 8 0.903 9 0.887 6 0.895 3 0.944 7 KRCC 0.439 0 0.690 3 0.668 9 0.598 3 0.752 4 0.729 0 0.731 2 0.818 2 TID2008[17] PLCC 0.632 0 0.756 8 0.776 7 0.899 3 0.865 0 0.865 4 0.876 3 0.926 5 SRCC 0.572 3 0.703 6 0.732 4 0.848 8 0.804 2 0.800 3 0.817 6 0.911 3 KRCC 0.425 3 0.498 9 0.541 9 0.646 0 0.630 2 0.609 8 0.638 9 0.748 7 TID2013[18] PLCC 0.579 8 0.696 3 0.722 5 0.852 4 0.844 3 0.895 7 0.911 1 0.951 0 SRCC 0.508 2 0.642 9 0.645 8 0.814 9 0.749 9 0.840 1 0.853 0 0.924 0 KRCC 0.362 8 0.453 6 0.468 7 0.610 9 0.568 7 0.659 5 0.688 7 0.768 0 加权平均值 PLCC 0.767 2 0.843 9 0.825 3 0.869 6 0.875 3 0.917 9 0.921 1 0.943 1 SRCC 0.724 9 0.812 3 0.792 7 0.845 0 0.836 6 0.890 7 0.898 1 0.930 5 KRCC 0.546 3 0.621 1 0.596 6 0.649 7 0.648 1 0.714 3 0.737 9 0.781 0 注:黑体数据表示最好结果。  下载: 导出CSV
表 5 跨数据库验证的性能
Table 5. Performance of cross-database verification
数据库 秩相关系数 CID2013[15] CCID2014[4] CSIQ[16] TID2008[17] TID2013[18] PLCC 0.922 0.663 0.580 0.540 CID2013[15] SRCC 0 0.902 0.653 0.556 0.503 KRCC 0.733 0.485 0.398 0.361 PLCC[16] 0.966 0.649 0.541 0.503 CCID2014[4] SRCC 0.965 0 0.626 0.500 0.458 KRCC 0.839 0.434 0.350 0.317 PLCC 0.588 0.540 0.771 0.769 CSIQ[16] SRCC 0.586 0.443 0 0.701 0.670 KRCC 0.401 0.302 0.520 0.490 PLCC 0.475 0.468 0.858 0.955 TID2008[17] SRCC 0.387 0.364 0.853 0 0.932 KRCC 0.277 0.260 0.641 0.787 PLCC 0.503 0.502 0.806 0.956 TID2013[18] SRCC 0.364 0.323 0.779 0.948 0 KRCC 0.261 0.248 0.553 0.809
下载: 导出CSV
表 6 三个数据库上不同训练集和测试集比例性能比较
Table 6. Performance comparison of different training set and test set ratios on three databases
下载: 导出CSV
表 7 在CSIQ数据库上不同失真类型图像的性能比较
Table 7. Performance comparison of different distortion types in CSIQ database
秩相关系数 JPEG JPEG2K GB WGN PGN GCD PLCC 0.913 0.891 0.908 0.942 0.931 0.966 SRCC 0.862 0.852 0.867 0.934 0.907 0.945 KRCC 0.688 0.684 0.702 0.801 0.773 0.818 注:黑体数据表示最好结果。
下载: 导出CSV
-
[1] GU K, ZHAI G T, YANG X K, et al. Automatic contrast enhancement technology with saliency preservation[J]. IEEE Transactions on Circuits and Systems for Video Technology, 2015, 25(9): 1480-1494. doi: 10.1109/TCSVT.2014.2372392 [2] WANG S Q, MA K D, YEGANEH H, et al. A patch-structure representation method for quality assessment of contrast changed images[J]. IEEE Signal Processing Letters, 2015, 22(12): 2387-2390. doi: 10.1109/LSP.2015.2487369 [3] SUN W, YANG W M, ZHOU F, et al. Full-reference quality assessment of contrast changed images based on local linear model[C]//2018 IEEE International Conference on Acoustics, Speech and Signal Processing. Piscataway: IEEE Press, 2018: 1228-1232. [4] GU K, ZHAI G T, LIN W S, et al. The analysis of image contrast: From quality assessment to automatic enhancement[J]. IEEE Transactions on Cybernetics, 2016, 46(1): 284-297. doi: 10.1109/TCYB.2015.2401732 [5] LIU M, GU K, ZHAI G T, et al. Perceptual reduced-reference visual quality assessment for contrast alteration[J]. IEEE Transactions on Broadcasting, 2017, 63(1): 71-81. [6] KIM D, LEE S, KIM C. Contextual information based quality assessment for contrast-changed images[J]. IEEE Signal Processing Letters, 2019, 26(1): 109-113. [7] FANG Y M, MA K D, WANG Z, et al. No-reference quality assessment of contrast-distorted images based on natural scene statistics[J]. IEEE Signal Processing Letters, 2015, 22(7): 838-842. [8] WU Y J, ZHU Y H, YANG Y, et al. A no-reference quality assessment for contrast-distorted image based on improved learning method[J]. Multimedia Tools and Applications, 2019, 78(8): 10057-10076. doi: 10.1007/s11042-018-6524-1 [9] GU K, LIN W S, ZHAI G T, et al. No-reference quality metric of contrast-distorted images based on information maximization[J]. IEEE Transactions on Cybernetics, 2017, 47(12): 4559-4565. doi: 10.1109/TCYB.2016.2575544 [10] GU K, TAO D C, QIAO J F, et al. Learning a no-reference quality assessment model of enhanced images with big data[J]. IEEE Transactions on Neural Networks and Learning Systems, 2018, 29(4): 1301-1313. doi: 10.1109/TNNLS.2017.2649101 [11] KHOSRAVI M H, HASSANPOUR H. Blind quality metric for contrast-distorted images based on eigen decomposition of color histograms[J]. IEEE Transactions on Circuits and Systems for Video Technology, 2020, 30(1): 48-58. [12] ZHOU Y, LI L D, ZHU H C, et al. No-reference quality assessment for contrast-distorted images based on multifaceted statistical representation of structure[J]. Journal of Visual Communication and Image Representation, 2019, 60: 158-169. doi: 10.1016/j.jvcir.2019.02.028 [13] LYU W J, LU W, MA M. No-reference quality metric for contrast-distorted image based on gradient domain and HSV space[J]. Journal of Visual Communication and Image Representation, 2020, 69: 102797. doi: 10.1016/j.jvcir.2020.102797 [14] GONZALEZ R C, WOODS R E. Digital image processing[M]. 3rd ed. Beijing: Publishing House of Electronics Industry, 2011. [15] GU K, ZHAI G T, YANG X K, et al. Subjective and objective quality assessment for images with contrast change[C]//2013 IEEE International Conference on Image Processing. Piscataway: IEEE Press, 2013: 383-387. [16] LARSON E C, CHANDLER D M. Most apparent distortion: Full-reference image quality assessment and the role of strategy[J]. Journal of Electronic Imaging, 2010, 19(1): 011006. [17] PONOMARENKO N, LUKIN V, ZELENSKY A, et al. TID2008-A database for evaluation of full-reference visual quality assessment metrics[J]. Advances of Modern Radio electronics, 2009, 10: 30-45. [18] PONOMARENKO N, IEREMEIEV O, LUKIN V, et al. Color image database TID2013: Peculiarities and preliminary results[C]//European Workshop on Visual Information Processing (EUVIP). Piscataway: IEEE Press, 2013: 106-111. [19] WILLIAMS C K I. Learning with kernels: Support vector machines, regularization, optimization, and beyond[J]. Journal of the American Statistical Association, 2003, 98(462): 489-490. [20] ANTONIO C, ENDER K, JAMIE S. Decision forests: A unified framework for classification, regression, density estimation, manifold learning and semi-supervised learning[J]. Foundations and Trends in Computer Graphics and Vision, 2011, 7(2-3): 81-227. -

 下载:
下载:


 点击查看大图
计量
- 文章访问数: 365
- HTML全文浏览量: 100
- PDF下载量: 43
- 被引次数: 0
